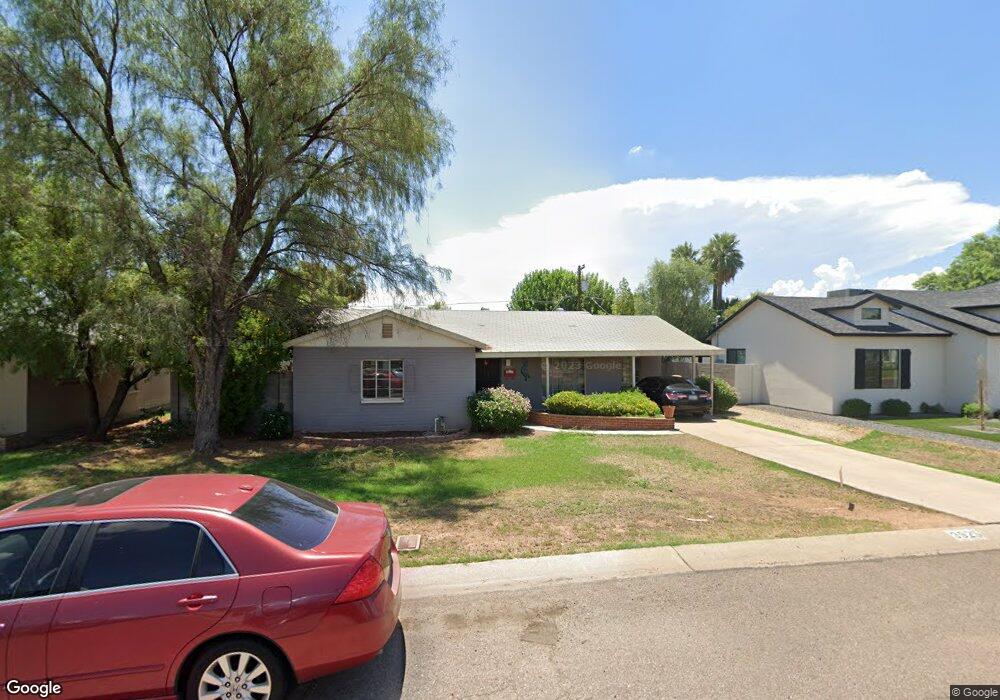
3925 E Devonshire Ave Phoenix, AZ 85018
Camelback East Village NeighborhoodEstimated Value: $570,000 - $947,000
3
Beds
2
Baths
1,558
Sq Ft
$504/Sq Ft
Est. Value
About This Home
This home is located at 3925 E Devonshire Ave, Phoenix, AZ 85018 and is currently estimated at $784,877, approximately $503 per square foot. 3925 E Devonshire Ave is a home located in Maricopa County with nearby schools including Biltmore Preparatory Academy, Camelback High School, and Phoenix Coding Academy.
Ownership History
Date
Name
Owned For
Owner Type
Purchase Details
Closed on
Mar 9, 2006
Sold by
Kovacs Laura
Bought by
Lunt Daniel J and Lunt Jenifer S
Current Estimated Value
Home Financials for this Owner
Home Financials are based on the most recent Mortgage that was taken out on this home.
Original Mortgage
$273,600
Outstanding Balance
$153,804
Interest Rate
6.08%
Mortgage Type
New Conventional
Estimated Equity
$631,073
Purchase Details
Closed on
Apr 18, 2003
Sold by
Performance Llc
Bought by
Kovacs Laura
Home Financials for this Owner
Home Financials are based on the most recent Mortgage that was taken out on this home.
Original Mortgage
$143,100
Interest Rate
4.37%
Mortgage Type
New Conventional
Purchase Details
Closed on
Jul 9, 2002
Sold by
Melanson William A and Melanson Gertrude E
Bought by
Schultz John A and Schultz Denise A
Home Financials for this Owner
Home Financials are based on the most recent Mortgage that was taken out on this home.
Original Mortgage
$122,000
Interest Rate
6.6%
Mortgage Type
New Conventional
Create a Home Valuation Report for This Property
The Home Valuation Report is an in-depth analysis detailing your home's value as well as a comparison with similar homes in the area
Home Values in the Area
Average Home Value in this Area
Purchase History
| Date | Buyer | Sale Price | Title Company |
|---|---|---|---|
| Lunt Daniel J | $342,000 | Chicago Title Insurance Co | |
| Kovacs Laura | $159,000 | Lawyers Title Of Arizona Inc | |
| Schultz John A | $152,500 | Grand Canyon Title Agency In |
Source: Public Records
Mortgage History
| Date | Status | Borrower | Loan Amount |
|---|---|---|---|
| Open | Lunt Daniel J | $273,600 | |
| Previous Owner | Kovacs Laura | $143,100 | |
| Previous Owner | Schultz John A | $122,000 | |
| Closed | Schultz John A | $15,200 |
Source: Public Records
Tax History
| Year | Tax Paid | Tax Assessment Tax Assessment Total Assessment is a certain percentage of the fair market value that is determined by local assessors to be the total taxable value of land and additions on the property. | Land | Improvement |
|---|---|---|---|---|
| 2025 | $3,674 | $27,205 | -- | -- |
| 2024 | $3,496 | $25,909 | -- | -- |
| 2023 | $3,496 | $50,120 | $10,020 | $40,100 |
| 2022 | $3,359 | $38,270 | $7,650 | $30,620 |
| 2021 | $3,441 | $37,070 | $7,410 | $29,660 |
| 2020 | $3,357 | $34,070 | $6,810 | $27,260 |
| 2019 | $3,333 | $31,610 | $6,320 | $25,290 |
| 2018 | $3,265 | $30,380 | $6,070 | $24,310 |
| 2017 | $3,138 | $27,970 | $5,590 | $22,380 |
| 2016 | $3,017 | $24,830 | $4,960 | $19,870 |
| 2015 | $2,807 | $23,010 | $4,600 | $18,410 |
Source: Public Records
Map
Nearby Homes
- 3838 E Devonshire Ave
- 3830 E Devonshire Ave
- 3821 E Devonshire Ave
- 3834 E Indian School Rd
- 4015 E Glenrosa Ave
- 4036 N 40th Place
- 4202 N 41st Place
- 3808 E Piccadilly Rd
- 4113 E Glenrosa Ave
- 4223 N 41st Place
- 4206 N 38th St Unit 1
- 4206 N 38th St Unit 4
- 4206 N 38th St Unit 6
- 3713 E Glenrosa Ave
- 3702 E Monterosa St Unit 6
- 3738 E Montecito Ave
- 3736 E Montecito Ave
- 4411 N 40th St Unit 51
- 3834 E Clarendon Ave
- 4001 E Indianola Ave
- 3919 E Devonshire Ave
- 3931 E Devonshire Ave
- 3926 E Monterosa St
- 3932 E Monterosa St
- 3920 E Monterosa St
- 3913 E Devonshire Ave
- 3937 E Devonshire Ave
- 3924 E Devonshire Ave
- 3918 E Devonshire Ave
- 3914 E Monterosa St
- 3938 E Monterosa St Unit 3
- 3932 E Devonshire Ave
- 3907 E Devonshire Ave Unit 3
- 3907 E Devonshire Ave
- 3943 E Devonshire Ave
- 3910 E Devonshire Ave
- 3908 E Monterosa St
- 3944 E Monterosa St
- 3940 E Devonshire Ave
- 3923 E Monterosa St
Your Personal Tour Guide
Ask me questions while you tour the home.