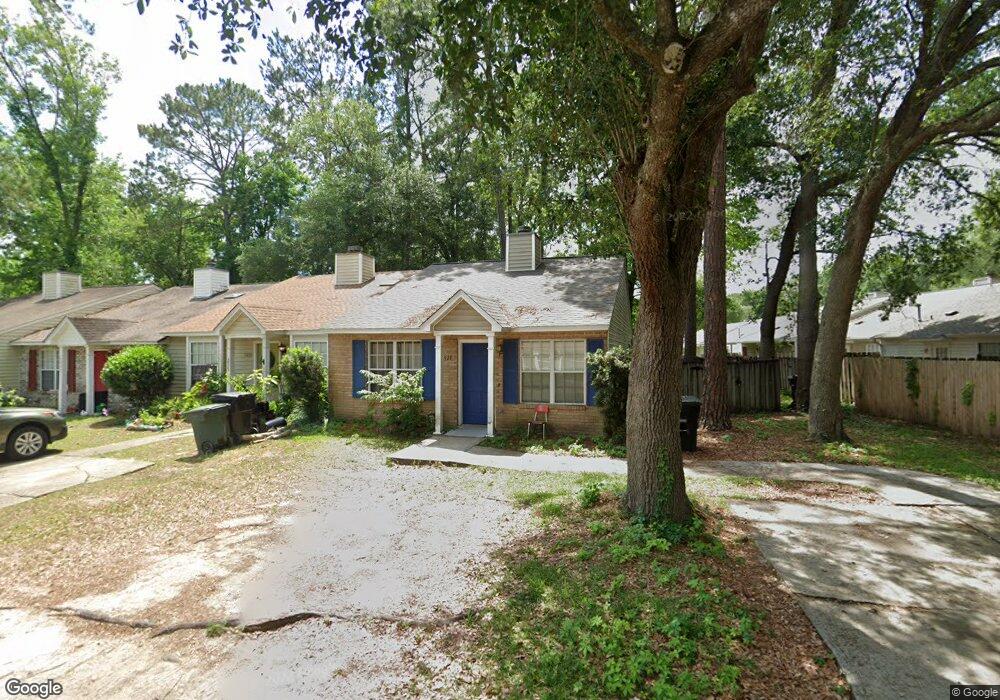
3929 Gaffney Loop Unit A Tallahassee, FL 32303
Northwest Tallahassee NeighborhoodEstimated Value: $165,223 - $177,000
2
Beds
2
Baths
984
Sq Ft
$175/Sq Ft
Est. Value
About This Home
This home is located at 3929 Gaffney Loop Unit A, Tallahassee, FL 32303 and is currently estimated at $172,056, approximately $174 per square foot. 3929 Gaffney Loop Unit A is a home located in Leon County with nearby schools including Astoria Park Elementary School, Griffin Middle School, and Amos P. Godby High School.
Ownership History
Date
Name
Owned For
Owner Type
Purchase Details
Closed on
Nov 22, 2021
Sold by
Peterson Robert M and Peterson Family Trust
Bought by
Peterson Robert M and Nancy Wpeterson
Current Estimated Value
Purchase Details
Closed on
Apr 17, 2012
Sold by
Peterson Nancy and Peterson Robert
Bought by
Peterson Robert M and Peterson Nancy W
Purchase Details
Closed on
Nov 18, 2011
Sold by
Roberts Stacey B
Bought by
Peterson Nancy and Peterson Robert
Purchase Details
Closed on
Sep 12, 2003
Sold by
Kidd Heather A and Hood Heather A
Bought by
Roberts Stacey B
Home Financials for this Owner
Home Financials are based on the most recent Mortgage that was taken out on this home.
Original Mortgage
$81,480
Interest Rate
6.13%
Purchase Details
Closed on
Dec 14, 1995
Sold by
Lunsford Patricia Ann
Bought by
Hood Heather A
Home Financials for this Owner
Home Financials are based on the most recent Mortgage that was taken out on this home.
Original Mortgage
$62,900
Interest Rate
7.41%
Mortgage Type
FHA
Create a Home Valuation Report for This Property
The Home Valuation Report is an in-depth analysis detailing your home's value as well as a comparison with similar homes in the area
Home Values in the Area
Average Home Value in this Area
Purchase History
| Date | Buyer | Sale Price | Title Company |
|---|---|---|---|
| Peterson Robert M | -- | None Listed On Document | |
| Peterson Robert M | -- | Attorney | |
| Peterson Nancy | $85,000 | Attorney | |
| Roberts Stacey B | $84,000 | -- | |
| Hood Heather A | $63,000 | -- |
Source: Public Records
Mortgage History
| Date | Status | Borrower | Loan Amount |
|---|---|---|---|
| Previous Owner | Roberts Stacey B | $81,480 | |
| Previous Owner | Hood Heather A | $62,900 |
Source: Public Records
Tax History
| Year | Tax Paid | Tax Assessment Tax Assessment Total Assessment is a certain percentage of the fair market value that is determined by local assessors to be the total taxable value of land and additions on the property. | Land | Improvement |
|---|---|---|---|---|
| 2025 | $2,641 | $148,942 | $35,000 | $113,942 |
| 2024 | $2,422 | $138,642 | $35,000 | $103,642 |
| 2023 | $2,191 | $109,964 | $0 | $0 |
| 2022 | $1,927 | $108,967 | $25,000 | $83,967 |
| 2021 | $1,744 | $90,879 | $22,000 | $68,879 |
| 2020 | $1,586 | $83,877 | $22,000 | $61,877 |
| 2019 | $1,484 | $77,618 | $18,000 | $59,618 |
| 2018 | $1,383 | $72,052 | $15,000 | $57,052 |
| 2017 | $1,270 | $65,032 | $0 | $0 |
| 2016 | $1,194 | $60,316 | $0 | $0 |
| 2015 | $1,112 | $59,393 | $0 | $0 |
| 2014 | $1,112 | $56,150 | $0 | $0 |
Source: Public Records
Map
Nearby Homes
- 4193 Mission Trace Blvd
- 3149 Sawtooth Dr
- 3361 Sawtooth Dr
- 3363 Golden Rain Dr
- 3108 Canmore Place
- 2909 Byington Cir
- 4434 Gearhart Rd Unit 2904
- 4434 Gearhart Rd Unit 1704
- 4434 Gearhart Rd Unit 2102
- 2989 Teton Trail
- Lot 16 Bellac Rd
- 2981 Teton Trail
- 4445 Wesley Dr
- 4457 Wesley Dr
- 3707 Caracus Ct
- 4408 Wesley Dr
- 2721 Faringdon Dr
- 4198 Miraflores Ln
- 3529 Wood Hill Dr
- 2711 Via Milano Ave Unit A
- 3929 Gaffney Loop
- 3925 Gaffney Loop
- 3921 Gaffney Loop
- 3961 Gaffney Loop Unit C & D
- 3961 Gaffney Loop Unit D
- 3963 Gaffney Loop
- 3959 Gaffney Loop
- 3965 Gaffney Loop
- 3917 Gaffney Loop Unit D
- 3913 Gaffney Loop Unit A
- 3913 Gaffney Loop
- 3971 Gaffney Loop Unit C
- 3971 Gaffney Loop
- 3909 Gaffney Loop Unit a
- 3909 Gaffney Loop Unit B
- 3909 Gaffney Loop
- 3973 Gaffney Loop
- 3928 Gaffney Loop Unit B
- 3930 Gaffney Loop Unit A
- 3930 Gaffney Loop
Your Personal Tour Guide
Ask me questions while you tour the home.