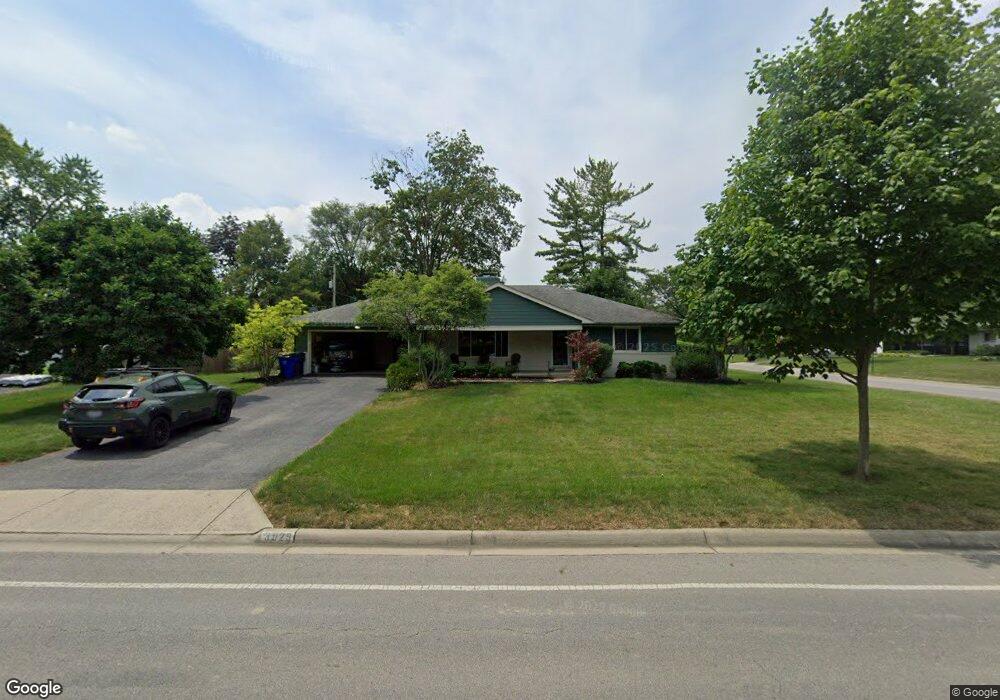
3929 Mountview Rd Columbus, OH 43220
Estimated Value: $482,747 - $577,000
3
Beds
3
Baths
1,425
Sq Ft
$367/Sq Ft
Est. Value
About This Home
This home is located at 3929 Mountview Rd, Columbus, OH 43220 and is currently estimated at $522,937, approximately $366 per square foot. 3929 Mountview Rd is a home located in Franklin County with nearby schools including Windermere Elementary School, Hastings Middle School, and Upper Arlington High School.
Ownership History
Date
Name
Owned For
Owner Type
Purchase Details
Closed on
Nov 17, 2021
Sold by
Keller Thomas C and Keller Carol A
Bought by
Anderson Troy and Anderson Kristyn M
Current Estimated Value
Home Financials for this Owner
Home Financials are based on the most recent Mortgage that was taken out on this home.
Original Mortgage
$315,000
Outstanding Balance
$287,071
Interest Rate
3.05%
Mortgage Type
New Conventional
Estimated Equity
$235,866
Purchase Details
Closed on
Oct 17, 2016
Sold by
Griffiths Jeffrey J and Griffiths Joyce P
Bought by
Killer Thomas C and Killer Carol A
Purchase Details
Closed on
May 2, 1996
Sold by
Loving E Mote
Bought by
Griffiths Jeffrey J and Griffiths Joyce P
Home Financials for this Owner
Home Financials are based on the most recent Mortgage that was taken out on this home.
Original Mortgage
$107,900
Interest Rate
7.86%
Mortgage Type
New Conventional
Create a Home Valuation Report for This Property
The Home Valuation Report is an in-depth analysis detailing your home's value as well as a comparison with similar homes in the area
Home Values in the Area
Average Home Value in this Area
Purchase History
| Date | Buyer | Sale Price | Title Company |
|---|---|---|---|
| Anderson Troy | $375,000 | New Title Company Name | |
| Killer Thomas C | $275,000 | Great American Title | |
| Griffiths Jeffrey J | $135,900 | -- |
Source: Public Records
Mortgage History
| Date | Status | Borrower | Loan Amount |
|---|---|---|---|
| Open | Anderson Troy | $315,000 | |
| Previous Owner | Griffiths Jeffrey J | $107,900 |
Source: Public Records
Tax History
| Year | Tax Paid | Tax Assessment Tax Assessment Total Assessment is a certain percentage of the fair market value that is determined by local assessors to be the total taxable value of land and additions on the property. | Land | Improvement |
|---|---|---|---|---|
| 2025 | $10,156 | $166,010 | $79,660 | $86,350 |
| 2024 | $10,156 | $166,010 | $79,660 | $86,350 |
| 2023 | $9,844 | $166,005 | $79,660 | $86,345 |
| 2022 | $9,523 | $131,570 | $64,650 | $66,920 |
| 2021 | $8,637 | $131,570 | $64,650 | $66,920 |
| 2020 | $8,381 | $131,570 | $64,650 | $66,920 |
| 2019 | $8,033 | $113,690 | $64,650 | $49,040 |
| 2018 | $7,304 | $113,690 | $64,650 | $49,040 |
| 2017 | $7,205 | $113,690 | $64,650 | $49,040 |
| 2016 | $6,461 | $97,720 | $39,760 | $57,960 |
| 2015 | $6,456 | $97,720 | $39,760 | $57,960 |
| 2014 | $6,463 | $97,720 | $39,760 | $57,960 |
| 2013 | $3,086 | $88,830 | $36,155 | $52,675 |
Source: Public Records
Map
Nearby Homes
- 2200 Nayland Rd
- 3670 Romnay Rd
- 4263 Gavin Ln
- 2413 Edgevale Rd
- 2411 Sheringham Rd
- 2458 Edgevale Rd
- 3949 Norbrook Dr
- 2533 Middlesex Rd
- 2475 Mccoy Rd
- 2177 Oakmount Rd
- 4370 Harborough Rd
- 2443 Shrewsbury Rd
- 2480 Shrewsbury Rd
- 2424 Nottingham Rd
- 2257 Swansea Rd
- 2375 Swansea Rd
- 3275 Colchester Rd
- 3418 Sunningdale Way
- 1605 Lafayette Dr Unit 1605
- 1842 Ridgecliff Rd
- 3915 Mountview Rd
- 3936 Chevington Rd
- 3922 Chevington Rd
- 3951 Mountview Rd
- 2066 Lytham Rd
- 3924 Mountview Rd
- 3905 Mountview Rd
- 3912 Mountview Rd
- 2078 Lytham Rd
- 3910 Chevington Rd
- 3940 Mountview Rd
- 3900 Mountview Rd
- 3891 Mountview Rd
- 2088 Lytham Rd
- 3969 Mountview Rd
- 1989 Lytham Rd
- 3956 Mountview Rd
- 2057 Middlesex Rd
- 2099 Lytham Rd
- 3894 Chevington Rd
Your Personal Tour Guide
Ask me questions while you tour the home.