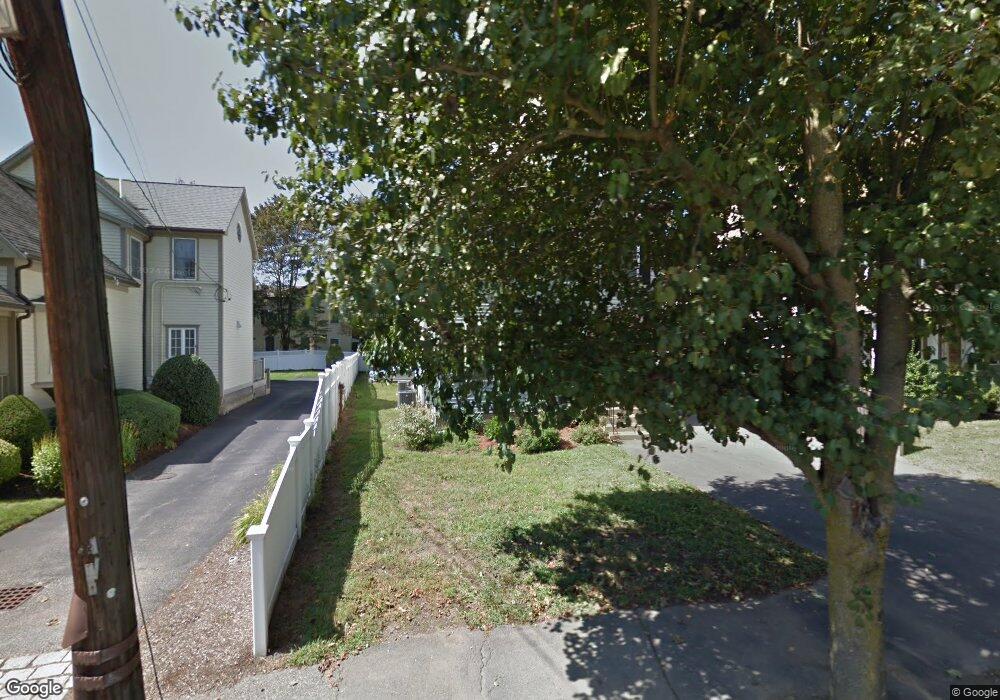
393 Cherry St Unit 395 West Newton, MA 02465
West Newton NeighborhoodEstimated Value: $1,241,000 - $1,587,455
4
Beds
2
Baths
2,682
Sq Ft
$526/Sq Ft
Est. Value
About This Home
This home is located at 393 Cherry St Unit 395, West Newton, MA 02465 and is currently estimated at $1,410,364, approximately $525 per square foot. 393 Cherry St Unit 395 is a home located in Middlesex County with nearby schools including Franklin Elementary School, C.C. Burr, and F.A. Day Middle School.
Ownership History
Date
Name
Owned For
Owner Type
Purchase Details
Closed on
Nov 5, 2014
Sold by
Gandolfi Rosina M
Bought by
Kane Built Inc
Current Estimated Value
Home Financials for this Owner
Home Financials are based on the most recent Mortgage that was taken out on this home.
Original Mortgage
$712,000
Outstanding Balance
$549,015
Interest Rate
4.18%
Mortgage Type
Purchase Money Mortgage
Estimated Equity
$861,349
Create a Home Valuation Report for This Property
The Home Valuation Report is an in-depth analysis detailing your home's value as well as a comparison with similar homes in the area
Home Values in the Area
Average Home Value in this Area
Purchase History
| Date | Buyer | Sale Price | Title Company |
|---|---|---|---|
| Kane Built Inc | $600,000 | -- |
Source: Public Records
Mortgage History
| Date | Status | Borrower | Loan Amount |
|---|---|---|---|
| Open | Kane Built Inc | $712,000 |
Source: Public Records
Tax History Compared to Growth
Tax History
| Year | Tax Paid | Tax Assessment Tax Assessment Total Assessment is a certain percentage of the fair market value that is determined by local assessors to be the total taxable value of land and additions on the property. | Land | Improvement |
|---|---|---|---|---|
| 2025 | $11,444 | $1,167,800 | $619,000 | $548,800 |
| 2024 | $11,066 | $1,133,800 | $601,000 | $532,800 |
| 2023 | $10,681 | $1,049,200 | $478,800 | $570,400 |
| 2022 | $10,220 | $971,500 | $443,300 | $528,200 |
| 2021 | $9,590 | $891,300 | $406,700 | $484,600 |
| 2020 | $9,305 | $891,300 | $406,700 | $484,600 |
| 2019 | $8,705 | $833,000 | $380,100 | $452,900 |
| 2018 | $8,697 | $803,800 | $358,600 | $445,200 |
| 2017 | $8,200 | $737,400 | $329,000 | $408,400 |
| 2016 | $7,699 | $676,500 | $301,800 | $374,700 |
| 2015 | $5,089 | $438,300 | $282,100 | $156,200 |
Source: Public Records
Map
Nearby Homes
- 371 Cherry St
- 66 Webster St
- 429 Cherry St Unit 11
- 2 Elm St Unit 6
- 2 Elm St Unit 8
- 106 River St Unit 18
- 106 River St Unit 2
- 106 River St Unit 14
- 287 Cherry St Unit 2
- 41 Kilburn Rd
- 44 Westland Ave
- 12 Inis Cir
- 79 Chestnut St Unit 2
- 42 Evergreen Cir
- 90 Auburndale Ave
- 1488 Washington St Unit 1488
- 56 Dearborn St
- 53-55 N Gate Park
- 212 River St Unit 2
- 10 Crescent St Unit 2
- 393 Cherry St Unit 1
- 391 Cherry St
- 389 Cherry St Unit 389
- 401 Cherry St
- 399 Cherry St
- 399 Cherry St Unit 399
- 399 Cherry St Unit 1
- 402 Cherry St Unit 402
- 383 Cherry St
- 383 Cherry St Unit 2G
- 405 Cherry St Unit 1
- 405 Cherry St Unit 405
- 54 Elm St Unit 54
- 56 Elm St
- 400 Cherry St
- 400 Cherry St Unit 402-Rear
- 400 Cherry St Unit 400-Front
- 62 Elm St Unit 66
- 62 Elm St
- 64 Elm St Unit 1