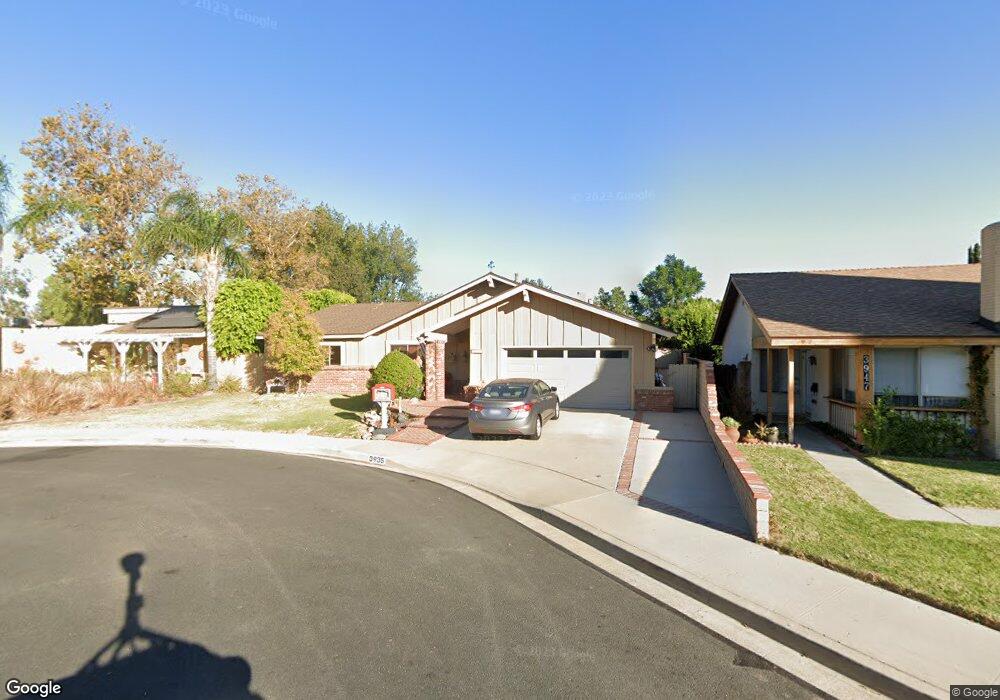
3935 Hibbert Ct Simi Valley, CA 93063
Central Simi Valley NeighborhoodEstimated Value: $376,000 - $826,000
3
Beds
2
Baths
1,108
Sq Ft
$603/Sq Ft
Est. Value
About This Home
This home is located at 3935 Hibbert Ct, Simi Valley, CA 93063 and is currently estimated at $667,846, approximately $602 per square foot. 3935 Hibbert Ct is a home located in Ventura County with nearby schools including Garden Grove Elementary School, Hillside Middle School, and Simi Valley High School.
Ownership History
Date
Name
Owned For
Owner Type
Purchase Details
Closed on
Aug 13, 2024
Sold by
Savoie Renee and Savoie Kevin
Bought by
Savoie Renee
Current Estimated Value
Home Financials for this Owner
Home Financials are based on the most recent Mortgage that was taken out on this home.
Original Mortgage
$45,000
Outstanding Balance
$42,968
Interest Rate
6.25%
Mortgage Type
Credit Line Revolving
Estimated Equity
$624,878
Purchase Details
Closed on
Jan 19, 2021
Sold by
Miller Adrian Gene
Bought by
Miller Dawn
Home Financials for this Owner
Home Financials are based on the most recent Mortgage that was taken out on this home.
Original Mortgage
$242,500
Interest Rate
2.6%
Mortgage Type
New Conventional
Purchase Details
Closed on
Jan 13, 2021
Sold by
Savoie Anne
Bought by
Savoie Kevin
Home Financials for this Owner
Home Financials are based on the most recent Mortgage that was taken out on this home.
Original Mortgage
$242,500
Interest Rate
2.6%
Mortgage Type
New Conventional
Create a Home Valuation Report for This Property
The Home Valuation Report is an in-depth analysis detailing your home's value as well as a comparison with similar homes in the area
Home Values in the Area
Average Home Value in this Area
Purchase History
| Date | Buyer | Sale Price | Title Company |
|---|---|---|---|
| Savoie Renee | $30,000 | Wfg Lender Services | |
| Miller Dawn | -- | Fntg Lenders Direct | |
| Savoie Kevin | -- | Fntg Lenders Direct | |
| Savoie Renee | $162,000 | None Listed On Document |
Source: Public Records
Mortgage History
| Date | Status | Borrower | Loan Amount |
|---|---|---|---|
| Open | Savoie Renee | $45,000 | |
| Previous Owner | Miller Dawn | $242,500 | |
| Previous Owner | Savoie Kevin | $242,500 |
Source: Public Records
Tax History
| Year | Tax Paid | Tax Assessment Tax Assessment Total Assessment is a certain percentage of the fair market value that is determined by local assessors to be the total taxable value of land and additions on the property. | Land | Improvement |
|---|---|---|---|---|
| 2025 | $1,480 | $68,475 | $19,556 | $48,919 |
| 2024 | $1,480 | $67,133 | $19,173 | $47,960 |
| 2023 | $1,389 | $65,817 | $18,797 | $47,020 |
| 2022 | $1,344 | $64,527 | $18,428 | $46,099 |
| 2021 | $1,298 | $63,262 | $18,066 | $45,196 |
| 2020 | $1,248 | $62,616 | $17,882 | $44,734 |
| 2019 | $1,187 | $61,389 | $17,532 | $43,857 |
| 2018 | $1,153 | $60,187 | $17,189 | $42,998 |
| 2017 | $1,110 | $59,007 | $16,852 | $42,155 |
| 2016 | $1,053 | $57,851 | $16,522 | $41,329 |
| 2015 | $1,013 | $56,984 | $16,275 | $40,709 |
| 2014 | $976 | $55,869 | $15,957 | $39,912 |
Source: Public Records
Map
Nearby Homes
- 3848 Lucas Ct
- 3998 Celia Ct
- 3918 Cochran St Unit 19
- 2197 Hurles Ave
- 4151 Gertrude St
- 4141 Eileen St
- 1814 Glenview Ave
- 1648 Rocky River Ct
- 3648 Woodhaven St
- 1870 Burch Ave
- 3550 Woodhaven St
- 4327 Lou Dr
- 1791 Sitka Ave
- 3474 Highwood Ct Unit 80
- 4321 Apricot Rd
- 3458 Highwood Ct Unit 198
- 2696 Santa Ynez Ave
- 2263 Workman Ave
- 2433 Medina Ave
- 3434 Highwood Ct Unit 183
- 3929 Hibbert Ct
- 3947 Hibbert Ct
- 3936 Goodwin Ave
- 3948 Goodwin Ave
- 3930 Goodwin Ave
- 3959 Hibbert Ct
- 3960 Goodwin Ave
- 3928 Hibbert Ct
- 3934 Hibbert Ct
- 3946 Hibbert Ct
- 3965 Hibbert Ct
- 3958 Hibbert Ct
- 3966 Goodwin Ave
- 3887 Lucas Ct
- 3890 Lucas Ct
- 3878 Gaines Ct
- 3977 Hibbert Ct
- 3923 Goodwin Ave
- 3937 Goodwin Ave
- 3931 Goodwin Ave
Your Personal Tour Guide
Ask me questions while you tour the home.