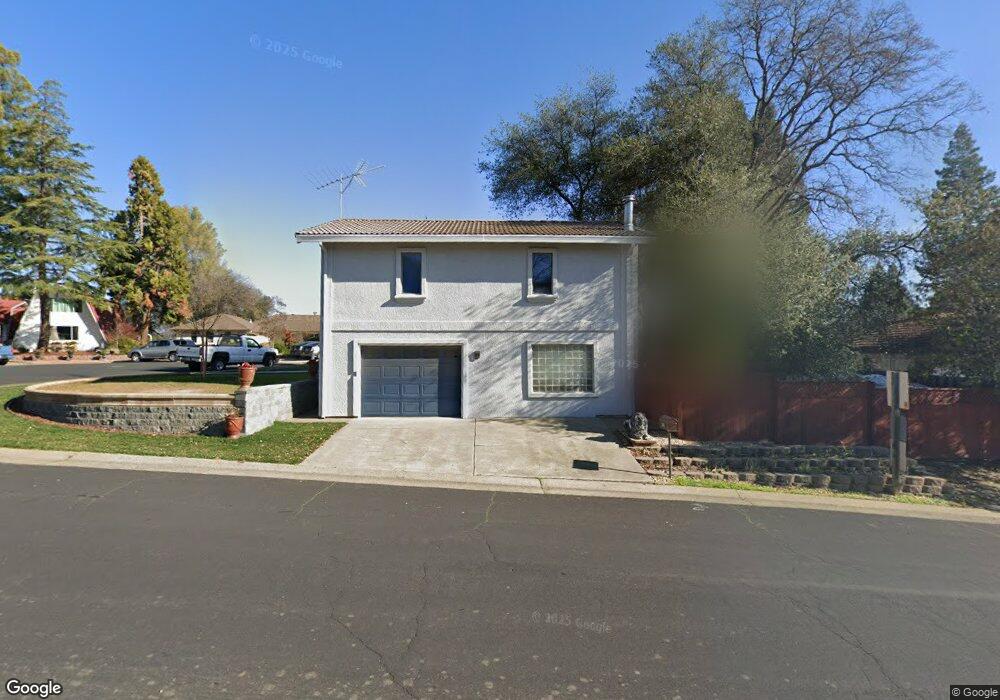
3935 N Lakeshore Blvd Loomis, CA 95650
Estimated Value: $555,000 - $742,000
3
Beds
2
Baths
1,386
Sq Ft
$477/Sq Ft
Est. Value
About This Home
This home is located at 3935 N Lakeshore Blvd, Loomis, CA 95650 and is currently estimated at $660,779, approximately $476 per square foot. 3935 N Lakeshore Blvd is a home located in Placer County with nearby schools including Del Oro High School.
Ownership History
Date
Name
Owned For
Owner Type
Purchase Details
Closed on
Apr 4, 2007
Sold by
Radford Mary Clare
Bought by
Radford Fred L
Current Estimated Value
Home Financials for this Owner
Home Financials are based on the most recent Mortgage that was taken out on this home.
Original Mortgage
$340,000
Outstanding Balance
$205,347
Interest Rate
6.13%
Mortgage Type
Stand Alone Refi Refinance Of Original Loan
Estimated Equity
$455,432
Purchase Details
Closed on
Apr 8, 2003
Sold by
Radford Fred L and Radford Shelly A
Bought by
Radford Fred L
Purchase Details
Closed on
Aug 2, 2000
Sold by
Lain Denise A
Bought by
Radford Fred L and Radford Shelly A
Home Financials for this Owner
Home Financials are based on the most recent Mortgage that was taken out on this home.
Original Mortgage
$183,280
Interest Rate
8.12%
Mortgage Type
Purchase Money Mortgage
Purchase Details
Closed on
Mar 31, 1995
Sold by
Lain Gary L
Bought by
Lain Denise A
Create a Home Valuation Report for This Property
The Home Valuation Report is an in-depth analysis detailing your home's value as well as a comparison with similar homes in the area
Home Values in the Area
Average Home Value in this Area
Purchase History
| Date | Buyer | Sale Price | Title Company |
|---|---|---|---|
| Radford Fred L | -- | Financial Title Company | |
| Radford Fred L | -- | -- | |
| Radford Fred L | $229,500 | North American Title Guarant | |
| Lain Denise A | -- | Sierra Valley Title Co |
Source: Public Records
Mortgage History
| Date | Status | Borrower | Loan Amount |
|---|---|---|---|
| Open | Radford Fred L | $340,000 | |
| Closed | Radford Fred L | $183,280 | |
| Closed | Radford Fred L | $22,910 |
Source: Public Records
Tax History Compared to Growth
Tax History
| Year | Tax Paid | Tax Assessment Tax Assessment Total Assessment is a certain percentage of the fair market value that is determined by local assessors to be the total taxable value of land and additions on the property. | Land | Improvement |
|---|---|---|---|---|
| 2025 | $4,931 | $345,195 | $150,673 | $194,522 |
| 2023 | $4,931 | $331,792 | $144,823 | $186,969 |
| 2022 | $4,877 | $325,287 | $141,984 | $183,303 |
| 2021 | $4,790 | $318,909 | $139,200 | $179,709 |
| 2020 | $4,749 | $315,640 | $137,773 | $177,867 |
| 2019 | $4,691 | $309,452 | $135,072 | $174,380 |
| 2018 | $4,516 | $303,385 | $132,424 | $170,961 |
| 2017 | $4,463 | $297,437 | $129,828 | $167,609 |
| 2016 | $4,398 | $291,606 | $127,283 | $164,323 |
| 2015 | $4,336 | $287,227 | $125,372 | $161,855 |
| 2014 | $4,291 | $281,602 | $122,917 | $158,685 |
Source: Public Records
Map
Nearby Homes
- 3959 Maresborough Place
- 3740 N Lakeshore Blvd
- 4300 Cognac Ct
- 9661 Clos Du Lac Cir
- 9345 Whiskey Bar Rd
- 9709 Rim Rock Cir
- 3599 Hector Rd
- 9605 Old Quarry Ct
- 9260 Miners Crossing
- 9742 Rim Rock Cir
- 9130 Quail Lake Ct
- 4800 Miners Cove Cir
- 3400 Kingmont Dr
- 9080 Horseshoe Bar Rd
- 5150 Lake Forest Dr
- 9260 Hilltop Place
- 4800 Auburn Folsom Rd Unit 59
- 4800 Auburn Folsom Rd Unit 77
- 4800 Auburn Folsom Rd Unit 38
- 4800 Auburn Folsom Rd Unit 70
- 3924 Lake Vista Ct
- 3945 N Lakeshore Blvd
- 3933 Lake Vista Ct
- 3940 N Lakeshore Blvd
- 3982 Horseshoe Cir
- 3933 3933 Lake Vista Ct
- 3930 N Lakeshore Blvd
- 3915 N Lakeshore Blvd
- 3950 N Lakeshore Blvd
- 3972 Horseshoe Cir
- 3962 Horseshoe Cir
- 3952 Horseshoe Cir
- 3993 Horseshoe Cir
- 3960 N Lakeshore Blvd
- 3942 Horseshoe Cir
- 3920 N Lakeshore Blvd
- 3991 Horseshoe Cir
- 3916 Horseshoe Cir
- 3905 N Lakeshore Blvd
- 3922 Horseshoe Cir