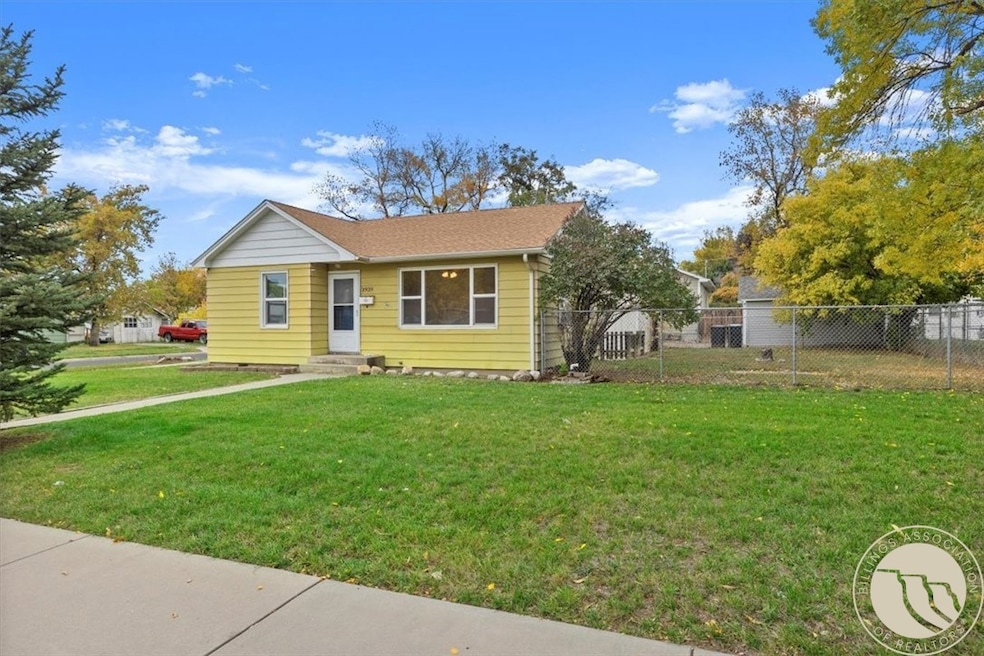
3939 3rd Ave S Billings, MT 59101
South Side NeighborhoodEstimated payment $1,251/month
Highlights
- Corner Lot
- 1 Car Detached Garage
- Patio
- Cottage
- Cooling Available
- Forced Air Heating System
About This Home
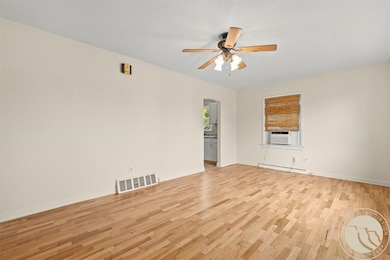
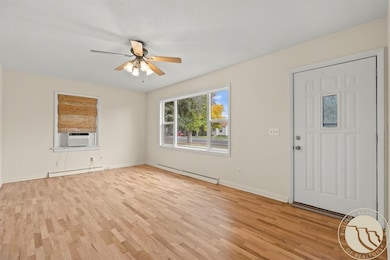
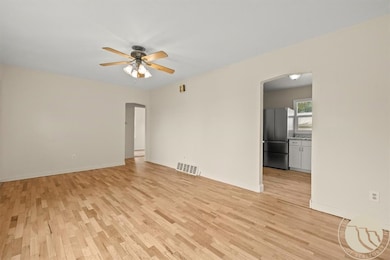
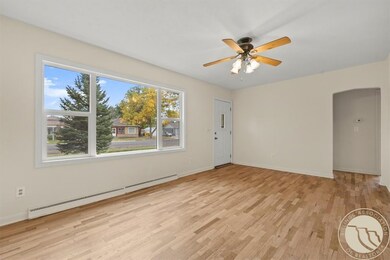
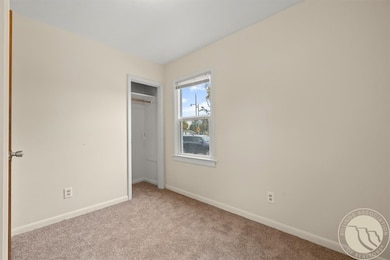
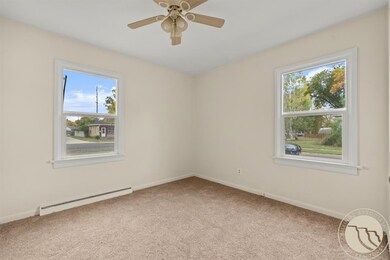
This recently renovated home is situated in an exceptional neighborhood. It comprises two bedrooms and one bathroom, with the bathroom undergoing a complete renovation in 2023. The spacious living room features newly refinished hardwood floors, while the charming kitchen is equipped with modern appliances from 2023. The main floor laundry area includes a stackable washer and dryer. Please note that there is no warranty on the washer and dryer, as they are older models. The backyard is fenced, and there is a well for irrigation. The home is located a block from Highland Park, which is equipped with numerous playground pieces and is a block in size. The interior has been repainted, and the carpet has been replaced. Additionally, a new sewer line was installed in 2022, a new sewer line in crawl space in 2025, and the windows were replaced in 2018.
Listing Agent
Downtown Realty Brokerage Phone: 406-690-3770 License #RRE-BRO-LIC-6896 Listed on: 10/13/2025
Home Details
Home Type
- Single Family
Est. Annual Taxes
- $1,542
Year Built
- Built in 1956 | Remodeled
Lot Details
- 6,750 Sq Ft Lot
- Fenced
- Corner Lot
- Zoning described as First Neighborhood Residential
Parking
- 1 Car Detached Garage
- Alley Access
Home Design
- Cottage
- Asphalt Roof
Interior Spaces
- 682 Sq Ft Home
- 1-Story Property
- Ceiling Fan
- Crawl Space
- Stacked Washer and Dryer
Kitchen
- Oven
- Induction Cooktop
Bedrooms and Bathrooms
- 2 Main Level Bedrooms
- 1 Full Bathroom
Outdoor Features
- Patio
Schools
- Orchard Elementary School
- Riverside Middle School
- Senior High School
Utilities
- Cooling Available
- Forced Air Heating System
- Well
Community Details
- Highland Addition Subdivision
Listing and Financial Details
- Assessor Parcel Number A08889
Map
Home Values in the Area
Average Home Value in this Area
Tax History
| Year | Tax Paid | Tax Assessment Tax Assessment Total Assessment is a certain percentage of the fair market value that is determined by local assessors to be the total taxable value of land and additions on the property. | Land | Improvement |
|---|---|---|---|---|
| 2025 | $1,542 | $184,100 | $38,976 | $145,124 |
| 2024 | $1,542 | $143,400 | $38,244 | $105,156 |
| 2023 | $1,548 | $143,400 | $38,244 | $105,156 |
| 2022 | $1,134 | $120,200 | $0 | $0 |
| 2021 | $1,408 | $120,200 | $0 | $0 |
| 2020 | $1,346 | $104,300 | $0 | $0 |
| 2019 | $1,282 | $104,300 | $0 | $0 |
| 2018 | $1,269 | $101,800 | $0 | $0 |
| 2017 | $1,232 | $101,800 | $0 | $0 |
| 2016 | $1,013 | $80,000 | $0 | $0 |
| 2015 | $984 | $80,000 | $0 | $0 |
| 2014 | $1,095 | $49,555 | $0 | $0 |
Property History
| Date | Event | Price | List to Sale | Price per Sq Ft |
|---|---|---|---|---|
| 10/13/2025 10/13/25 | For Sale | $214,900 | -- | $315 / Sq Ft |
Purchase History
| Date | Type | Sale Price | Title Company |
|---|---|---|---|
| Warranty Deed | -- | None Listed On Document | |
| Warranty Deed | -- | None Available | |
| Warranty Deed | -- | None Available |
Mortgage History
| Date | Status | Loan Amount | Loan Type |
|---|---|---|---|
| Previous Owner | $96,000 | Purchase Money Mortgage | |
| Previous Owner | $70,000 | Purchase Money Mortgage |
Source: Billings Multiple Listing Service
MLS Number: 356062
APN: 03-0927-04-4-05-02-0000
Disclaimer: Certain information contained herein is derived from information provided by parties other than Homes.com. All information provided is deemed reliable, but is not guaranteed to be accurate and should be independently verified.
![]() IDX information is provided exclusively for personal, non-commercial use, and may not be used for any purpose other than to identify prospective properties consumers may be interested in purchasing. Information is deemed reliable but not guaranteed.
IDX information is provided exclusively for personal, non-commercial use, and may not be used for any purpose other than to identify prospective properties consumers may be interested in purchasing. Information is deemed reliable but not guaranteed.
- 4131 Buchanan Ave
- 319 S 37th St
- 323 S 37th St
- 222 Terry Ave
- 3615 6th Ave S
- 516 S 36th St
- 3510 5th Ave S
- 38 Broadwater Ave
- 328 Viceroy St
- 137 Jefferson St
- 223 Custer Ave
- 3318 2nd Ave S
- 112 Wyoming Ave
- 418 Cook Ave
- 413,415 S 34th Unit 413
- 3310 1st Ave S
- 223 Broadwater Ave
- 514 S 33rd St
- 329 Jackson St
- 428 Custer Ave
- 214 S 32nd St
- 2915 2nd Ave S Unit Downtown Loft 202
- 2915 2nd Ave S Unit 205
- 429 N 33rd St
- 820 Central Ave
- 608 N 30th St
- 420 Lordwith Dr Unit Lordwith Unit #19
- 420 Lordwith Dr
- 124 N 24th St
- 2310 1st Ave N
- 1203 Broadwater Ave
- 1228 Broadwater Ave Unit 2
- 1329 Lynn Ave
- 1044 N 25th St Unit 1044.5 N 25th St
- 1331 Lynn Ave
- 1042 N 24th St
- 4950 Southgate Dr
- 1148 N 25th St
- 1204 Avenue E
- 1105 N 22nd St
