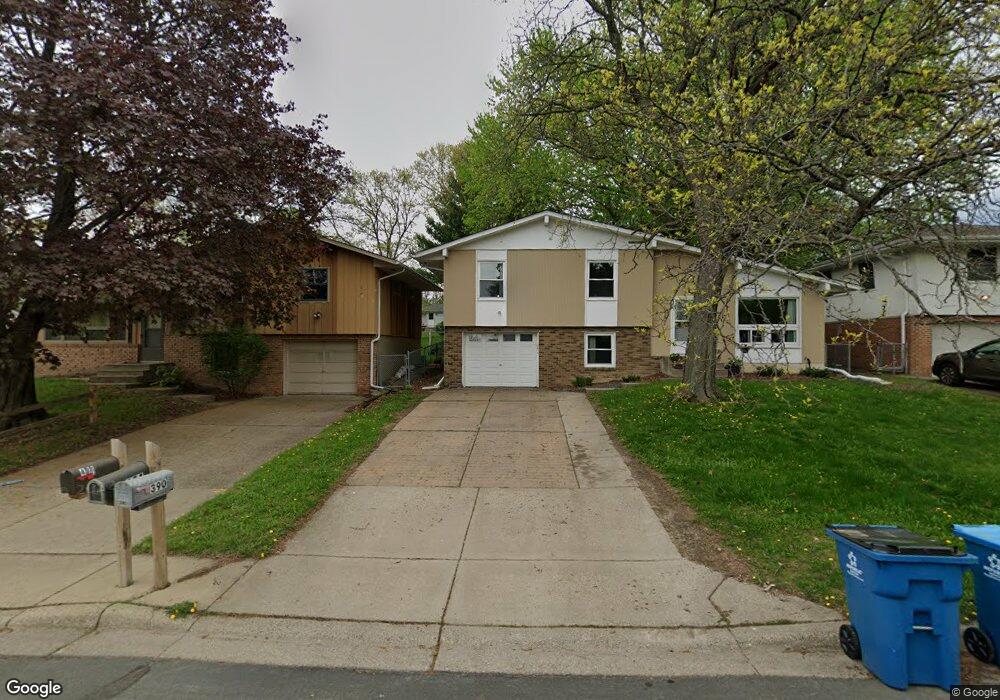
394 Haskell St E Saint Paul, MN 55118
Estimated Value: $314,914 - $328,000
4
Beds
2
Baths
1,477
Sq Ft
$217/Sq Ft
Est. Value
About This Home
This home is located at 394 Haskell St E, Saint Paul, MN 55118 and is currently estimated at $321,229, approximately $217 per square foot. 394 Haskell St E is a home located in Dakota County with nearby schools including Moreland Arts & Health Sciences Magnet School, Heritage E-STEM Magnet School, and Two Rivers High School.
Ownership History
Date
Name
Owned For
Owner Type
Purchase Details
Closed on
Apr 14, 2021
Sold by
Grapentine Sara A and Grapentine William T
Bought by
Purtell Laura Jeanne Lillian and Purtell Michael Paul
Current Estimated Value
Home Financials for this Owner
Home Financials are based on the most recent Mortgage that was taken out on this home.
Original Mortgage
$315,084
Outstanding Balance
$287,754
Interest Rate
3.05%
Mortgage Type
VA
Estimated Equity
$32,210
Purchase Details
Closed on
Aug 28, 2015
Sold by
Krueger Gerald R and Krueger Catherine L
Bought by
Vander Werff Sara A and Grapentine William T
Home Financials for this Owner
Home Financials are based on the most recent Mortgage that was taken out on this home.
Original Mortgage
$154,375
Interest Rate
3.97%
Mortgage Type
New Conventional
Create a Home Valuation Report for This Property
The Home Valuation Report is an in-depth analysis detailing your home's value as well as a comparison with similar homes in the area
Home Values in the Area
Average Home Value in this Area
Purchase History
| Date | Buyer | Sale Price | Title Company |
|---|---|---|---|
| Purtell Laura Jeanne Lillian | $308,000 | Results Title | |
| Vander Werff Sara A | $162,500 | Burnet Title | |
| Purtell Laura Laura | $308,000 | -- |
Source: Public Records
Mortgage History
| Date | Status | Borrower | Loan Amount |
|---|---|---|---|
| Open | Purtell Laura Jeanne Lillian | $315,084 | |
| Previous Owner | Vander Werff Sara A | $154,375 | |
| Previous Owner | Krueger Gerald R | $136,000 | |
| Closed | Purtell Laura Laura | $300,916 |
Source: Public Records
Tax History Compared to Growth
Tax History
| Year | Tax Paid | Tax Assessment Tax Assessment Total Assessment is a certain percentage of the fair market value that is determined by local assessors to be the total taxable value of land and additions on the property. | Land | Improvement |
|---|---|---|---|---|
| 2023 | $3,344 | $269,900 | $69,100 | $200,800 |
| 2022 | $2,536 | $256,700 | $68,800 | $187,900 |
| 2021 | $2,384 | $208,700 | $59,800 | $148,900 |
| 2020 | $2,274 | $196,600 | $57,000 | $139,600 |
| 2019 | $2,144 | $184,200 | $54,300 | $129,900 |
| 2018 | $1,894 | $168,100 | $50,700 | $117,400 |
| 2017 | $1,737 | $157,300 | $48,300 | $109,000 |
| 2016 | $1,774 | $141,700 | $43,900 | $97,800 |
| 2015 | $1,599 | $119,720 | $35,833 | $83,887 |
| 2014 | -- | $104,024 | $32,106 | $71,918 |
| 2013 | -- | $95,413 | $28,930 | $66,483 |
Source: Public Records
Map
Nearby Homes
- 909 Christensen Ave
- 267 Haskell St E
- 377 Winona St E
- 1560 Stickney Ave
- 978 Oakdale Ave
- 485 Belvidere St E
- 301 Butler Ave E
- 261 Stanley St
- 492 Curtice St E
- 190 Annapolis St E
- 272 Butler Ave E
- 178 Mainzer St
- 171 Bernard St E
- 751 Woodbury St
- 241 Sidney St E
- 322 Baker St E
- 277 Morton St E
- 300 Baker St E
- 1243 Oakdale Ave
- 184 Baker St E
- 390 Haskell St E
- 400 Haskell St E
- 382 Haskell St E
- 389 389 Haskell St E
- 382 Haskell St E
- 393 Mainzer St
- 399 Mainzer St
- 389 Mainzer St
- 382 382 Haskell-Street-e
- 405 Mainzer St
- 393 Haskell St E
- 383 Mainzer St
- 393 Haskell St E
- 389 Haskell St E
- 401 Haskell St E
- 412 Haskell St E
- 383 Haskell St E
- 388 388 Mainzer St
- 415 Mainzer St
- 372 Haskell St E