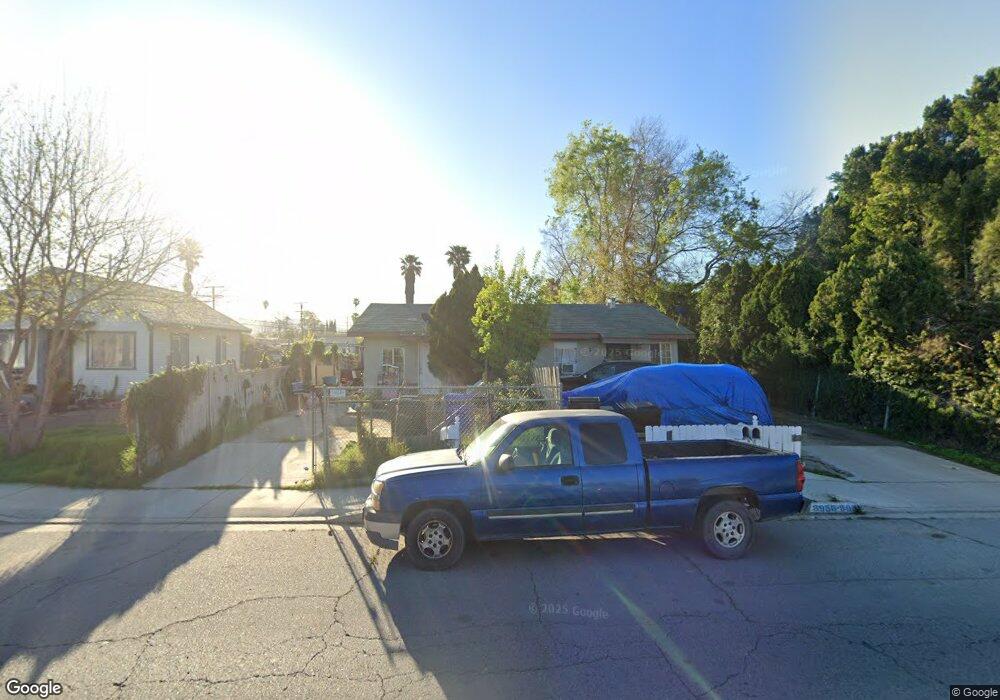
3958 Rubidoux Blvd Riverside, CA 92509
Rubidoux NeighborhoodEstimated Value: $513,054 - $654,000
4
Beds
3
Baths
2,047
Sq Ft
$280/Sq Ft
Est. Value
About This Home
This home is located at 3958 Rubidoux Blvd, Riverside, CA 92509 and is currently estimated at $573,764, approximately $280 per square foot. 3958 Rubidoux Blvd is a home located in Riverside County with nearby schools including West Riverside Elementary, Mission Middle School, and Rubidoux High School.
Ownership History
Date
Name
Owned For
Owner Type
Purchase Details
Closed on
Dec 1, 2005
Sold by
Robles Roberto Perez
Bought by
Franco Miguel A
Current Estimated Value
Home Financials for this Owner
Home Financials are based on the most recent Mortgage that was taken out on this home.
Original Mortgage
$270,000
Outstanding Balance
$161,692
Interest Rate
7.5%
Mortgage Type
Balloon
Estimated Equity
$412,072
Purchase Details
Closed on
Feb 13, 2003
Sold by
Perez Silvia
Bought by
Robles Roberto Perez
Purchase Details
Closed on
Nov 13, 2002
Sold by
Heyming Frank T and Heyming Lucy E
Bought by
Franco Miguel A and Robles Roberto Perez
Home Financials for this Owner
Home Financials are based on the most recent Mortgage that was taken out on this home.
Original Mortgage
$192,283
Interest Rate
5.89%
Mortgage Type
FHA
Create a Home Valuation Report for This Property
The Home Valuation Report is an in-depth analysis detailing your home's value as well as a comparison with similar homes in the area
Home Values in the Area
Average Home Value in this Area
Purchase History
| Date | Buyer | Sale Price | Title Company |
|---|---|---|---|
| Franco Miguel A | -- | Ticor Title Company Of Ca | |
| Robles Roberto Perez | -- | First American Title Co | |
| Franco Miguel A | -- | First American Title Co | |
| Franco Miguel A | $195,000 | First American Title Co |
Source: Public Records
Mortgage History
| Date | Status | Borrower | Loan Amount |
|---|---|---|---|
| Open | Franco Miguel A | $270,000 | |
| Previous Owner | Franco Miguel A | $192,283 | |
| Closed | Franco Miguel A | $5,400 |
Source: Public Records
Tax History
| Year | Tax Paid | Tax Assessment Tax Assessment Total Assessment is a certain percentage of the fair market value that is determined by local assessors to be the total taxable value of land and additions on the property. | Land | Improvement |
|---|---|---|---|---|
| 2025 | $4,530 | $407,667 | $97,689 | $309,978 |
| 2023 | $4,530 | $391,839 | $93,897 | $297,942 |
| 2022 | $4,350 | $384,156 | $92,056 | $292,100 |
| 2021 | $4,004 | $347,926 | $90,251 | $257,675 |
| 2020 | $3,589 | $310,648 | $89,326 | $221,322 |
| 2019 | $3,469 | $301,600 | $87,575 | $214,025 |
| 2018 | $3,295 | $290,000 | $90,000 | $200,000 |
| 2017 | $3,157 | $275,000 | $50,000 | $225,000 |
| 2016 | $3,062 | $265,000 | $50,000 | $215,000 |
| 2015 | $2,896 | $250,000 | $50,000 | $200,000 |
| 2014 | $1,792 | $160,000 | $38,000 | $122,000 |
Source: Public Records
Map
Nearby Homes
- 3969 Twining St
- 0 Mission Blvd Unit IG25268475
- 0 Mission Blvd Unit PW25275749
- 0 Mission Blvd Unit IV23139894
- 3747 Mintern St
- 5442 Mission Blvd
- 5748 Tilton Ave
- 5754 Tilton Ave
- 3634 Pioneer Dr
- 0 42nd St
- 5803 Mission Blvd
- 3825 Crestmore Rd Unit 494
- 3825 Crestmore Rd Unit 378
- 3825 Crestmore Rd Unit 480
- 5970 Sky Meadow St
- 5479 34th St
- 0 Odell St
- 3319 Avalon St Unit 78
- 3319 Avalon St Unit Space 62
- 3319 Avalon St Unit 39
- 3944 Rubidoux Blvd
- 3966 Rubidoux Blvd
- 3930 Rubidoux Blvd
- 3976 Rubidoux Blvd
- 3920 Rubidoux Blvd
- 3986 Rubidoux Blvd
- 3955 Fort Dr
- 3941 Fort Dr
- 3939 Rubidoux Blvd
- 3925 Rubidoux Blvd
- 3953 Rubidoux Blvd
- 3967 Fort Dr
- 3973 Fort Dr
- 5580 Molino Way
- 3913 Rubidoux Blvd
- 3963 Rubidoux Blvd
- 3998 Rubidoux Blvd
- 3908 Rubidoux Blvd
- 5562 Molino Way
- 3901 Rubidoux Blvd