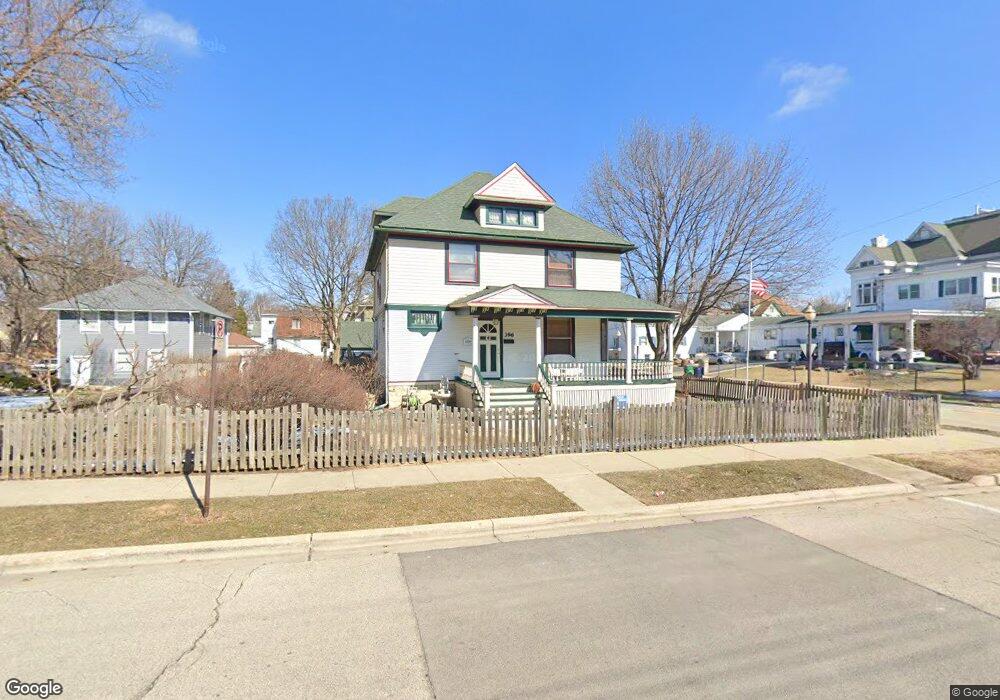
396 Division St Elgin, IL 60120
Gifford Park NeighborhoodEstimated Value: $278,426 - $322,000
4
Beds
1
Bath
1,837
Sq Ft
$163/Sq Ft
Est. Value
About This Home
This home is located at 396 Division St, Elgin, IL 60120 and is currently estimated at $298,607, approximately $162 per square foot. 396 Division St is a home located in Kane County with nearby schools including Ronald D O'Neal Elementary School, Larsen Middle School, and Elgin High School.
Ownership History
Date
Name
Owned For
Owner Type
Purchase Details
Closed on
Jan 31, 1996
Sold by
Neighborhood Housing Svcs Of Elgin Inc
Bought by
Coletti Curt and Coletti Josephine
Current Estimated Value
Home Financials for this Owner
Home Financials are based on the most recent Mortgage that was taken out on this home.
Original Mortgage
$97,600
Outstanding Balance
$3,213
Interest Rate
7.07%
Mortgage Type
Purchase Money Mortgage
Estimated Equity
$295,394
Purchase Details
Closed on
Sep 14, 1995
Sold by
Ecker Center For Mental Health Inc
Bought by
Neighborhood Housing Services Of Elgin
Home Financials for this Owner
Home Financials are based on the most recent Mortgage that was taken out on this home.
Original Mortgage
$100,000
Interest Rate
7.81%
Mortgage Type
Construction
Create a Home Valuation Report for This Property
The Home Valuation Report is an in-depth analysis detailing your home's value as well as a comparison with similar homes in the area
Home Values in the Area
Average Home Value in this Area
Purchase History
| Date | Buyer | Sale Price | Title Company |
|---|---|---|---|
| Coletti Curt | -- | -- | |
| Neighborhood Housing Services Of Elgin | -- | -- |
Source: Public Records
Mortgage History
| Date | Status | Borrower | Loan Amount |
|---|---|---|---|
| Open | Coletti Curt | $97,600 | |
| Previous Owner | Neighborhood Housing Services Of Elgin | $100,000 |
Source: Public Records
Tax History
| Year | Tax Paid | Tax Assessment Tax Assessment Total Assessment is a certain percentage of the fair market value that is determined by local assessors to be the total taxable value of land and additions on the property. | Land | Improvement |
|---|---|---|---|---|
| 2024 | $5,574 | $77,654 | $14,361 | $63,293 |
| 2023 | $5,298 | $70,154 | $12,974 | $57,180 |
| 2022 | $5,026 | $63,968 | $11,830 | $52,138 |
| 2021 | $4,800 | $59,805 | $11,060 | $48,745 |
| 2020 | $4,458 | $54,877 | $10,558 | $44,319 |
| 2019 | $4,322 | $52,274 | $10,057 | $42,217 |
| 2018 | $3,869 | $45,138 | $9,474 | $35,664 |
| 2017 | $3,772 | $42,671 | $8,956 | $33,715 |
| 2016 | $3,582 | $39,587 | $8,309 | $31,278 |
| 2015 | -- | $36,285 | $7,616 | $28,669 |
| 2014 | -- | $35,837 | $7,522 | $28,315 |
| 2013 | -- | $41,910 | $7,720 | $34,190 |
Source: Public Records
Map
Nearby Homes
- 131 N Gifford St
- 371 North St
- 408 E Chicago St
- 268 N Gifford St
- 363 Franklin Blvd
- 453 Addison St
- 489 Division St
- 58 S Geneva St
- 258 Ann St Unit 60
- 211 Prairie St
- 585 Park St
- 162 Festival Ct
- 268 Seneca St
- 277 Gifford Place
- 464 Prospect St
- 286 Villa St
- 483 Barrett St
- 409 Algona Ave
- 96 S Crystal St
- 160 Ludeka Place
- 114 N Gifford St
- 384 Division St
- 297 Division St
- 40 N Gifford St
- 118 N Gifford St
- 393 Division St
- 38 N Gifford St
- 105 N Gifford St
- 403 Division St
- 34 N Gifford St
- 122 N Gifford St Unit 124
- 122 N Gifford St Unit 24
- 378 Division St
- 389 Division St
- 405 Division St
- 121 N Gifford St
- 30 N Gifford St
- 383 Division St
- 28 N Gifford St
- 128 N Gifford St
Your Personal Tour Guide
Ask me questions while you tour the home.