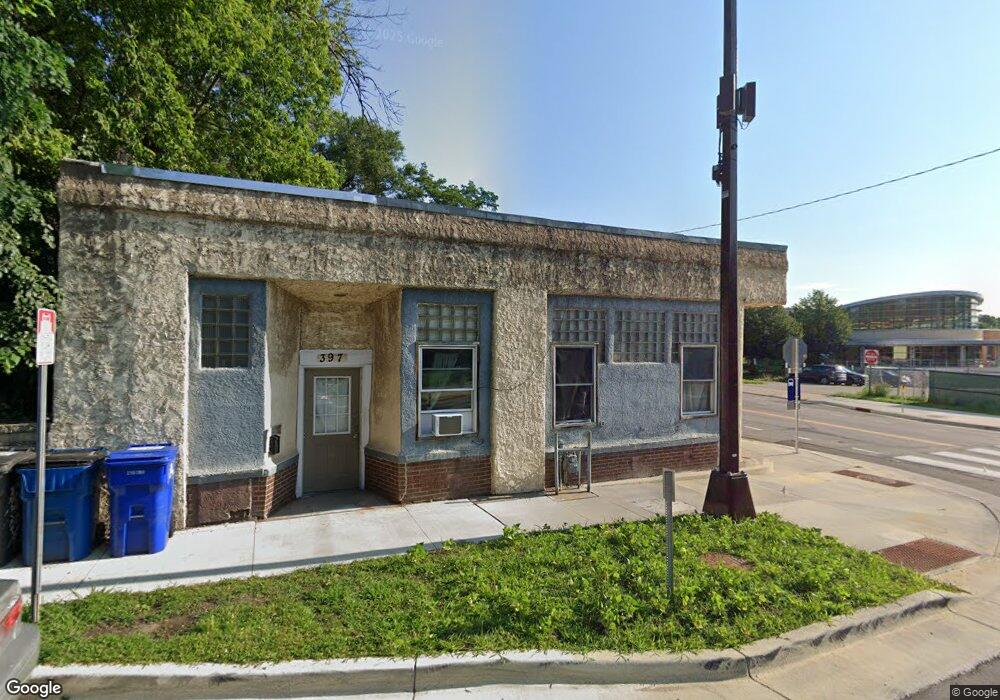
397 Case Ave Saint Paul, MN 55130
Payne-Phalen NeighborhoodEstimated Value: $230,000 - $332,000
7
Beds
3
Baths
2,542
Sq Ft
$108/Sq Ft
Est. Value
About This Home
This home is located at 397 Case Ave, Saint Paul, MN 55130 and is currently estimated at $275,333, approximately $108 per square foot. 397 Case Ave is a home located in Ramsey County with nearby schools including Bruce F Vento Elementary School, Washington Technology Magnet School, and Community Of Peace Academy.
Ownership History
Date
Name
Owned For
Owner Type
Purchase Details
Closed on
May 2, 2008
Sold by
Wells Fargo Bank Na
Bought by
Vue Bee
Current Estimated Value
Purchase Details
Closed on
May 3, 2004
Sold by
Volk Mann Henry William
Bought by
Vue Bee
Purchase Details
Closed on
Aug 30, 2000
Sold by
Donnay Gary G and Donnay Susan C
Bought by
Vue Bee
Purchase Details
Closed on
Mar 25, 1998
Sold by
Volkmann William H
Bought by
Donnay Gary G and Donnay Susan C
Purchase Details
Closed on
Apr 2, 1996
Sold by
Volkmann William
Bought by
Volkmann William H
Create a Home Valuation Report for This Property
The Home Valuation Report is an in-depth analysis detailing your home's value as well as a comparison with similar homes in the area
Home Values in the Area
Average Home Value in this Area
Purchase History
| Date | Buyer | Sale Price | Title Company |
|---|---|---|---|
| Vue Bee | $35,000 | -- | |
| Vue Bee | $50,000 | -- | |
| Vue Bee | $50,000 | -- | |
| Donnay Gary G | $37,000 | -- | |
| Volkmann William H | $44,000 | -- |
Source: Public Records
Mortgage History
| Date | Status | Borrower | Loan Amount |
|---|---|---|---|
| Closed | Donnay Gary G | -- |
Source: Public Records
Tax History
| Year | Tax Paid | Tax Assessment Tax Assessment Total Assessment is a certain percentage of the fair market value that is determined by local assessors to be the total taxable value of land and additions on the property. | Land | Improvement |
|---|---|---|---|---|
| 2025 | $4,182 | $203,400 | $25,000 | $178,400 |
| 2023 | $4,182 | $169,100 | $20,000 | $149,100 |
| 2022 | $4,364 | $138,400 | $20,000 | $118,400 |
| 2021 | $2,938 | $120,000 | $20,000 | $100,000 |
| 2020 | $2,154 | $85,000 | $7,400 | $77,600 |
| 2019 | $1,918 | $65,400 | $7,400 | $58,000 |
| 2018 | $1,550 | $50,300 | $7,400 | $42,900 |
| 2017 | $2,284 | $60,200 | $7,400 | $52,800 |
| 2016 | $1,654 | $0 | $0 | $0 |
| 2015 | $3,084 | $63,400 | $7,400 | $56,000 |
| 2014 | $2,660 | $0 | $0 | $0 |
Source: Public Records
Map
Nearby Homes
- 880 Clark St
- 955 Burr St
- 1054 Arkwright St
- 955 Bradley St
- 1067 Jessie St
- 363 Geranium Ave E
- 768 Desoto St
- 582 York Ave
- 1039 Edgerton St
- 760 Desoto St
- 601 Sims Ave
- 1038 Edgerton St
- 177 Granite St
- 419 Rose Ave E
- 587 Cook Ave E
- 184 Granite St
- 608 Wells St
- 417 Mount Ida St
- 1092 Edgerton St
- 620 Cook Ave E
Your Personal Tour Guide
Ask me questions while you tour the home.