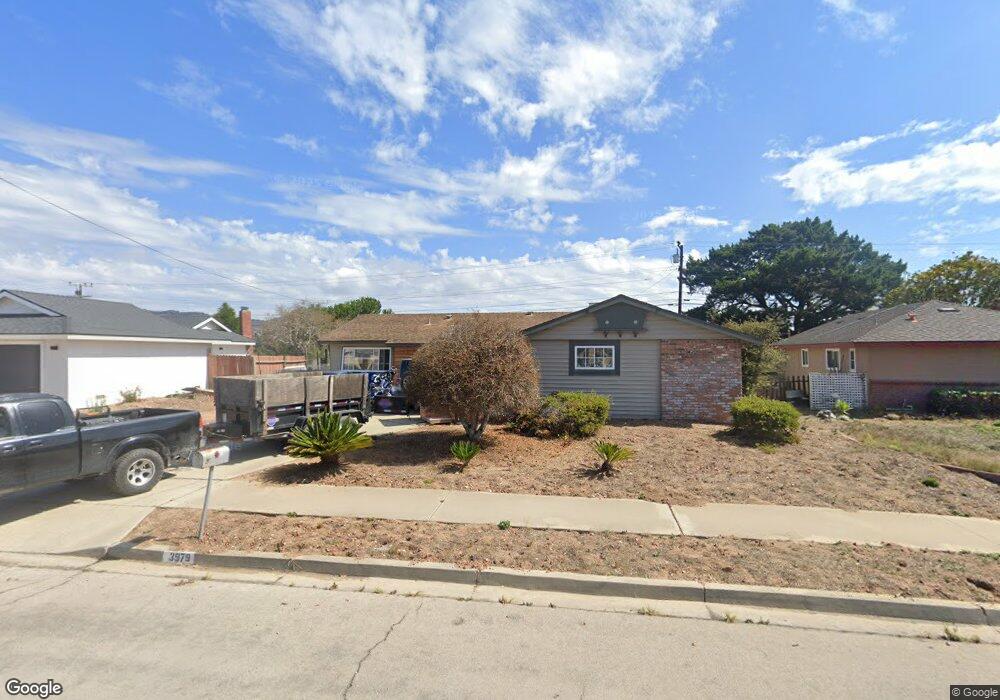
3979 Agena Way Lompoc, CA 93436
Estimated Value: $530,000 - $637,000
3
Beds
2
Baths
1,170
Sq Ft
$511/Sq Ft
Est. Value
About This Home
This home is located at 3979 Agena Way, Lompoc, CA 93436 and is currently estimated at $597,641, approximately $510 per square foot. 3979 Agena Way is a home located in Santa Barbara County with nearby schools including Buena Vista Elementary School, Cabrillo High School, and Olive Grove Charter - Lompoc.
Ownership History
Date
Name
Owned For
Owner Type
Purchase Details
Closed on
Oct 6, 2016
Sold by
Phillips Randal E and Phillips Patricia A
Bought by
Phillips Randal E and Phillips Patricia A
Current Estimated Value
Purchase Details
Closed on
Feb 5, 2013
Sold by
Phillips Joshua E
Bought by
Phillips Randal E and Phillips Patricia A
Home Financials for this Owner
Home Financials are based on the most recent Mortgage that was taken out on this home.
Original Mortgage
$154,000
Outstanding Balance
$29,053
Interest Rate
2.61%
Mortgage Type
New Conventional
Estimated Equity
$568,588
Purchase Details
Closed on
Jan 27, 2004
Sold by
Nelson Susan and Adamson David
Bought by
Phillips Joshua E and Phillips Randal E
Home Financials for this Owner
Home Financials are based on the most recent Mortgage that was taken out on this home.
Original Mortgage
$271,200
Outstanding Balance
$125,334
Interest Rate
5.62%
Mortgage Type
Purchase Money Mortgage
Estimated Equity
$472,307
Create a Home Valuation Report for This Property
The Home Valuation Report is an in-depth analysis detailing your home's value as well as a comparison with similar homes in the area
Home Values in the Area
Average Home Value in this Area
Purchase History
| Date | Buyer | Sale Price | Title Company |
|---|---|---|---|
| Phillips Randal E | -- | None Available | |
| Phillips Randal E | -- | First American Title Company | |
| Phillips Joshua E | $339,000 | Chicago Title Company |
Source: Public Records
Mortgage History
| Date | Status | Borrower | Loan Amount |
|---|---|---|---|
| Open | Phillips Randal E | $154,000 | |
| Open | Phillips Joshua E | $271,200 |
Source: Public Records
Tax History
| Year | Tax Paid | Tax Assessment Tax Assessment Total Assessment is a certain percentage of the fair market value that is determined by local assessors to be the total taxable value of land and additions on the property. | Land | Improvement |
|---|---|---|---|---|
| 2025 | $5,283 | $481,968 | $248,805 | $233,163 |
| 2023 | $5,283 | $406,000 | $209,000 | $197,000 |
| 2022 | $4,845 | $398,000 | $205,000 | $193,000 |
| 2021 | $4,385 | $346,000 | $178,000 | $168,000 |
| 2020 | $3,860 | $301,000 | $155,000 | $146,000 |
| 2019 | $3,733 | $289,000 | $149,000 | $140,000 |
| 2018 | $3,584 | $275,000 | $142,000 | $133,000 |
| 2017 | $3,347 | $262,000 | $135,000 | $127,000 |
| 2016 | $2,799 | $238,000 | $123,000 | $115,000 |
| 2014 | $2,575 | $216,000 | $111,000 | $105,000 |
Source: Public Records
Map
Nearby Homes
- 232 Vega Ave
- 250 Saint Andrews Way
- 4166 Oakwood Ct
- 4173 Oakwood Ct
- 3939 Mesa Circle Dr
- 113 Gemini Ave
- 6 Stanford Cir
- 3922 Mesa Circle Dr
- 3916 Mesa Circle Dr Unit A
- 73 Stanford Cir
- 4447 Falcon Dr
- 18 Galaxy Way
- 384 Falcon Crest Dr
- 372 Oak Hill Dr
- 649 Burning Tree Way
- 372 Falcon Crest Dr
- 0 Oak Hill Dr Unit 24-783
- 240 Oak Hill Dr
- 4473 Greenbrier Rd
- 3843 Cassini Cir Unit 3
Your Personal Tour Guide
Ask me questions while you tour the home.