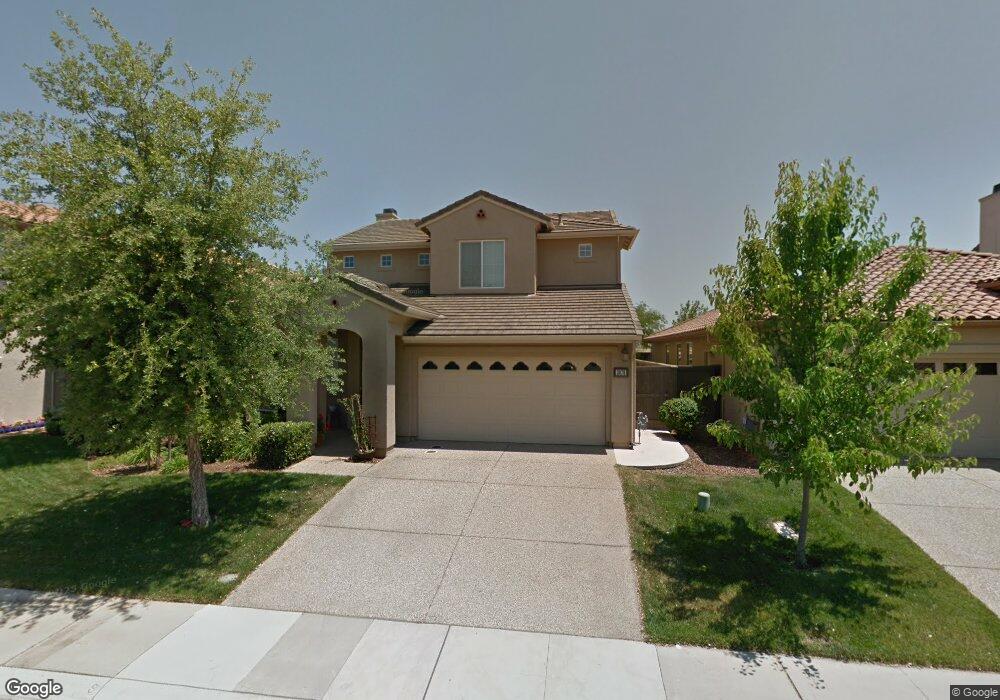
3979 Riley Anton Way Rancho Cordova, CA 95742
Anatolia NeighborhoodEstimated Value: $469,000 - $638,565
5
Beds
3
Baths
2,389
Sq Ft
$243/Sq Ft
Est. Value
About This Home
This home is located at 3979 Riley Anton Way, Rancho Cordova, CA 95742 and is currently estimated at $580,641, approximately $243 per square foot. 3979 Riley Anton Way is a home located in Sacramento County with nearby schools including Sunrise Elementary School, Katherine L. Albiani Middle School, and Pleasant Grove High School.
Ownership History
Date
Name
Owned For
Owner Type
Purchase Details
Closed on
Oct 22, 2021
Sold by
Wilson Norman A and Sonnenburg Anissa
Bought by
Wilson Norman A and Sonnenburg Anissa M
Current Estimated Value
Purchase Details
Closed on
Jul 20, 2006
Sold by
Lennar Renaissance Inc
Bought by
Wilson Norman A and Sonnenburg Anissa
Home Financials for this Owner
Home Financials are based on the most recent Mortgage that was taken out on this home.
Original Mortgage
$371,950
Outstanding Balance
$219,841
Interest Rate
6.57%
Mortgage Type
Purchase Money Mortgage
Estimated Equity
$360,800
Purchase Details
Closed on
Mar 3, 2005
Sold by
Gmac Model Home Finance Inc
Bought by
Lennar Renaissance Inc
Create a Home Valuation Report for This Property
The Home Valuation Report is an in-depth analysis detailing your home's value as well as a comparison with similar homes in the area
Home Values in the Area
Average Home Value in this Area
Purchase History
| Date | Buyer | Sale Price | Title Company |
|---|---|---|---|
| Wilson Norman A | -- | None Available | |
| Wilson Norman A | -- | None Available | |
| Wilson Norman A | $465,000 | North American Title Co | |
| Lennar Renaissance Inc | -- | North American Title Co |
Source: Public Records
Mortgage History
| Date | Status | Borrower | Loan Amount |
|---|---|---|---|
| Open | Wilson Norman A | $371,950 |
Source: Public Records
Tax History Compared to Growth
Tax History
| Year | Tax Paid | Tax Assessment Tax Assessment Total Assessment is a certain percentage of the fair market value that is determined by local assessors to be the total taxable value of land and additions on the property. | Land | Improvement |
|---|---|---|---|---|
| 2025 | $9,017 | $622,918 | $200,961 | $421,957 |
| 2024 | $9,017 | $610,705 | $197,021 | $413,684 |
| 2023 | $8,787 | $598,731 | $193,158 | $405,573 |
| 2022 | $8,602 | $586,992 | $189,371 | $397,621 |
| 2021 | $8,160 | $540,703 | $174,438 | $366,265 |
| 2020 | $7,351 | $470,178 | $151,686 | $318,492 |
| 2019 | $7,027 | $443,565 | $143,100 | $300,465 |
| 2018 | $6,750 | $426,506 | $137,597 | $288,909 |
| 2017 | $6,375 | $394,914 | $127,405 | $267,509 |
| 2016 | $6,081 | $372,561 | $120,194 | $252,367 |
| 2015 | $5,803 | $351,474 | $113,391 | $238,083 |
| 2014 | $5,595 | $334,737 | $107,991 | $226,746 |
Source: Public Records
Map
Nearby Homes
- 3063 Banano Way
- 3930 Riley Anton Way
- 4036 Valance Way
- 11918 Herodian Dr
- 11926 Herodian Dr
- 11962 Granzella Way
- 4081 Valance Way
- 3908 Valance Way
- 4048 Kalamata Way
- 11786 Socrates Way
- Plan 1 at Montelena - Vista
- Plan 1 at Montelena - Ascent
- Plan 4 at Montelena - Ascent
- Plan 2 at Montelena - Ascent
- Plan 3 at Montelena - Ascent
- Plan 1 at Montelena - Solis
- 11781 Plato Way
- 11751 Village Pond Way
- 11790 Bagota Way
- 11791 Battenburg Way
- 3975 Riley Anton Way
- 3983 Riley Anton Way
- 4012 Valance Way
- 3971 Riley Anton Way
- 3987 Riley Anton Way
- 4008 Valance Way
- 4016 Valance Way
- 4008 Marsyas Way
- 4020 Valance Way
- 4004 Valance Way
- 11889 White Rain Way
- 3967 Riley Anton Way
- 3991 Riley Anton Way
- 11888 White Rain Way
- 11885 White Rain Way
- 3963 Riley Anton Way
- 3995 Riley Anton Way
- 11884 White Rain Way
- 4000 Valance Way
- 4024 Valance Way