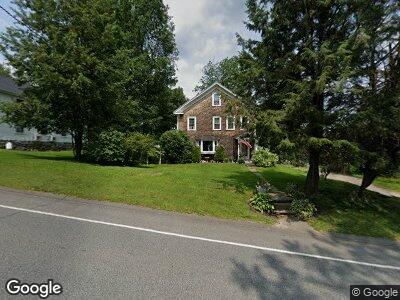
398 Main Rd Chesterfield, MA 01012
Estimated Value: $297,377 - $388,000
3
Beds
2
Baths
2,100
Sq Ft
$165/Sq Ft
Est. Value
About This Home
This home is located at 398 Main Rd, Chesterfield, MA 01012 and is currently estimated at $347,094, approximately $165 per square foot. 398 Main Rd is a home located in Hampshire County with nearby schools including Hampshire Regional High School.
Ownership History
Date
Name
Owned For
Owner Type
Purchase Details
Closed on
Jan 7, 2013
Sold by
Tadiello Ronald
Bought by
Tadiello Ronald and Ritchie Charlene L
Current Estimated Value
Home Financials for this Owner
Home Financials are based on the most recent Mortgage that was taken out on this home.
Original Mortgage
$171,000
Outstanding Balance
$120,878
Interest Rate
3.35%
Mortgage Type
New Conventional
Estimated Equity
$226,216
Purchase Details
Closed on
May 28, 2010
Sold by
Mhfa
Bought by
Tadiello Ronald W
Home Financials for this Owner
Home Financials are based on the most recent Mortgage that was taken out on this home.
Original Mortgage
$178,045
Interest Rate
5.5%
Mortgage Type
FHA
Purchase Details
Closed on
Dec 28, 2009
Sold by
Wells Nancy
Bought by
Mhfa
Purchase Details
Closed on
Oct 19, 2007
Sold by
Russell Michael P and Russell Sharon M
Bought by
Wells Nancy
Home Financials for this Owner
Home Financials are based on the most recent Mortgage that was taken out on this home.
Original Mortgage
$181,450
Interest Rate
6.51%
Mortgage Type
Purchase Money Mortgage
Create a Home Valuation Report for This Property
The Home Valuation Report is an in-depth analysis detailing your home's value as well as a comparison with similar homes in the area
Home Values in the Area
Average Home Value in this Area
Purchase History
| Date | Buyer | Sale Price | Title Company |
|---|---|---|---|
| Tadiello Ronald | -- | -- | |
| Tadiello Ronald W | $169,000 | -- | |
| Mhfa | $130,000 | -- | |
| Wells Nancy | $191,000 | -- |
Source: Public Records
Mortgage History
| Date | Status | Borrower | Loan Amount |
|---|---|---|---|
| Open | Tadiello Ronald | $65,000 | |
| Open | Russell Thomas W | $171,000 | |
| Previous Owner | Tadiello Ronald W | $178,045 | |
| Previous Owner | Wells Nancy | $181,450 | |
| Previous Owner | Russell Thomas W | $20,000 |
Source: Public Records
Tax History Compared to Growth
Tax History
| Year | Tax Paid | Tax Assessment Tax Assessment Total Assessment is a certain percentage of the fair market value that is determined by local assessors to be the total taxable value of land and additions on the property. | Land | Improvement |
|---|---|---|---|---|
| 2025 | $4,377 | $282,000 | $26,500 | $255,500 |
| 2024 | $4,075 | $272,200 | $25,200 | $247,000 |
| 2023 | $3,754 | $235,800 | $24,200 | $211,600 |
| 2022 | $3,719 | $203,800 | $24,200 | $179,600 |
| 2021 | $3,626 | $179,500 | $24,200 | $155,300 |
| 2020 | $3,523 | $175,200 | $24,200 | $151,000 |
| 2019 | $3,412 | $170,700 | $23,300 | $147,400 |
| 2018 | $4,723 | $167,900 | $23,300 | $144,600 |
| 2017 | $4,713 | $166,400 | $23,200 | $143,200 |
| 2016 | $3,084 | $164,400 | $23,200 | $141,200 |
| 2015 | $3,182 | $166,700 | $22,700 | $144,000 |
| 2014 | $3,074 | $166,700 | $22,700 | $144,000 |
Source: Public Records
Map
Nearby Homes