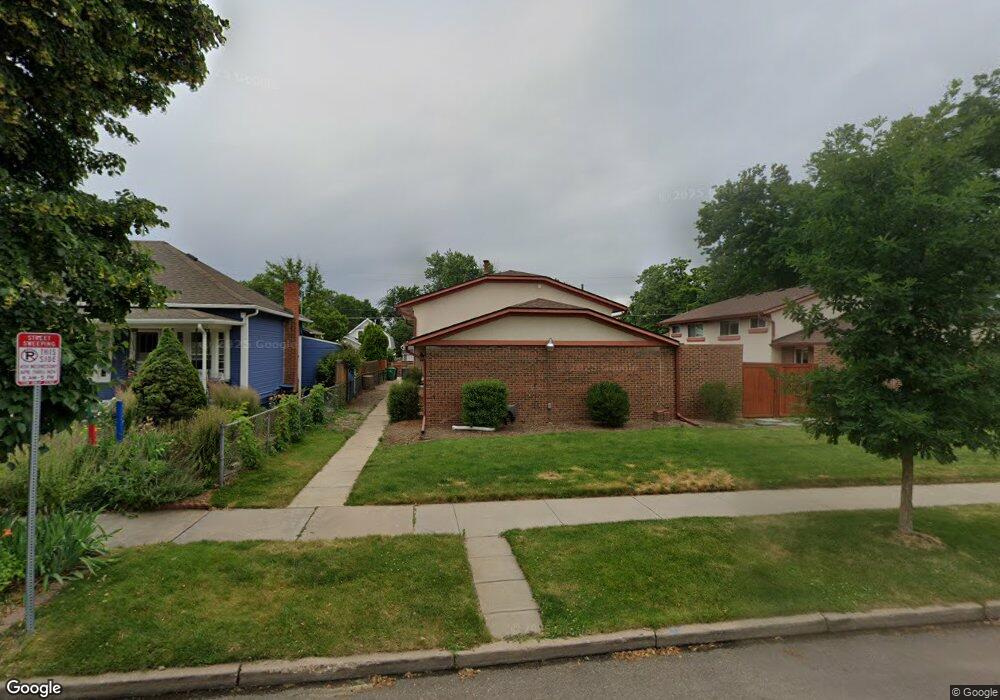
3985 Vrain St Denver, CO 80212
Berkeley NeighborhoodEstimated Value: $951,000
6
Beds
4
Baths
2,679
Sq Ft
$355/Sq Ft
Est. Value
About This Home
This home is located at 3985 Vrain St, Denver, CO 80212 and is currently estimated at $951,000, approximately $354 per square foot. 3985 Vrain St is a home located in Denver County with nearby schools including Bryant Webster Dual Language School, Skinner Middle School, and Denver Montessori Junior/Senior High School.
Ownership History
Date
Name
Owned For
Owner Type
Purchase Details
Closed on
Feb 16, 2020
Sold by
Alsabih Assam and Alsabih Susan
Bought by
Alsabih Assam and Alsabih Penny
Current Estimated Value
Home Financials for this Owner
Home Financials are based on the most recent Mortgage that was taken out on this home.
Original Mortgage
$505,950
Outstanding Balance
$444,141
Interest Rate
3.6%
Mortgage Type
New Conventional
Estimated Equity
$506,859
Purchase Details
Closed on
Oct 25, 2017
Sold by
The Della Ray Trust and Ray Paula
Bought by
Alsabim Assam and Alsabim Susan
Home Financials for this Owner
Home Financials are based on the most recent Mortgage that was taken out on this home.
Original Mortgage
$819,760
Outstanding Balance
$679,011
Interest Rate
3.78%
Mortgage Type
New Conventional
Estimated Equity
$271,989
Purchase Details
Closed on
Aug 12, 2016
Sold by
Ray Della
Bought by
Della Ray Trust
Purchase Details
Closed on
Jan 17, 1997
Sold by
Della Ray
Bought by
Ray Della and Ray Paula
Create a Home Valuation Report for This Property
The Home Valuation Report is an in-depth analysis detailing your home's value as well as a comparison with similar homes in the area
Home Values in the Area
Average Home Value in this Area
Purchase History
| Date | Buyer | Sale Price | Title Company |
|---|---|---|---|
| Alsabih Assam | -- | None Available | |
| Alsabim Assam | $693,000 | Land Title Guarantee Co | |
| Della Ray Trust | -- | None Available | |
| Ray Della | -- | -- |
Source: Public Records
Mortgage History
| Date | Status | Borrower | Loan Amount |
|---|---|---|---|
| Open | Alsabih Assam | $505,950 | |
| Open | Alsabim Assam | $819,760 |
Source: Public Records
Tax History
| Year | Tax Paid | Tax Assessment Tax Assessment Total Assessment is a certain percentage of the fair market value that is determined by local assessors to be the total taxable value of land and additions on the property. | Land | Improvement |
|---|---|---|---|---|
| 2025 | $4,484 | $69,210 | $59,450 | $59,450 |
| 2024 | $4,484 | $56,620 | $48,630 | $7,990 |
| 2023 | $4,387 | $56,620 | $48,630 | $7,990 |
| 2022 | $4,119 | $51,790 | $38,230 | $13,560 |
| 2021 | $4,064 | $54,460 | $40,200 | $14,260 |
| 2020 | $3,920 | $52,840 | $33,500 | $19,340 |
| 2019 | $3,811 | $52,840 | $33,500 | $19,340 |
| 2018 | $3,295 | $42,590 | $26,990 | $15,600 |
| 2017 | $2,730 | $42,590 | $26,990 | $15,600 |
| 2016 | $2,092 | $33,620 | $21,134 | $12,486 |
| 2015 | $2,005 | $33,620 | $21,134 | $12,486 |
| 2014 | $1,643 | $26,370 | $14,917 | $11,453 |
Source: Public Records
Map
Nearby Homes
- 3960 Winona Ct
- 4640 W 39th Ave
- 3860 Vrain St
- 3885 Wolff St
- 3868 Utica St
- 3845 Utica St
- 4258 Tennyson St Unit 101
- 4258 Tennyson St Unit 104
- 4735 W 38th Ave
- 2611 Stuart St
- 4206 Stuart St
- 3820 Xavier St
- 4141 Yates St
- 3895 Yates St
- 4914 W 38th Ave
- 4121 Zenobia St
- 4435 Tennyson St
- 3746 Yates St
- 4450 Utica St
- 3880 Sheridan Blvd
Your Personal Tour Guide
Ask me questions while you tour the home.