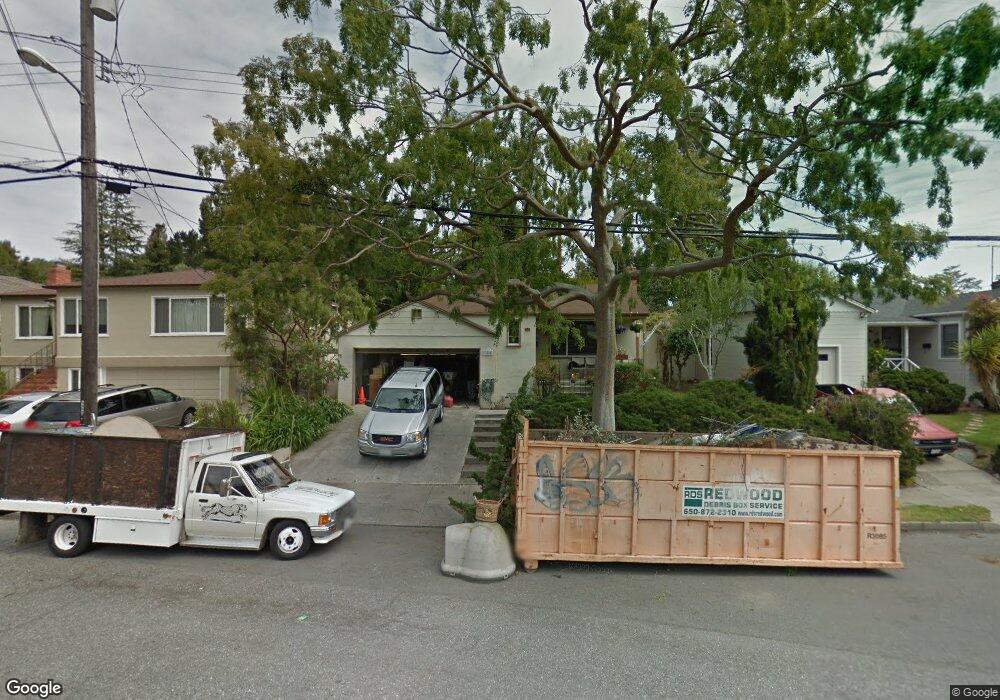
399 Cedar St San Carlos, CA 94070
Cordes NeighborhoodEstimated Value: $2,055,000 - $2,558,000
3
Beds
2
Baths
1,410
Sq Ft
$1,603/Sq Ft
Est. Value
About This Home
This home is located at 399 Cedar St, San Carlos, CA 94070 and is currently estimated at $2,260,505, approximately $1,603 per square foot. 399 Cedar St is a home located in San Mateo County with nearby schools including Arundel Elementary School, Tierra Linda Middle School, and Carlmont High School.
Ownership History
Date
Name
Owned For
Owner Type
Purchase Details
Closed on
Oct 19, 2015
Sold by
Brosnan Neil
Bought by
Holley Brosnan Leslie Denise
Current Estimated Value
Purchase Details
Closed on
Nov 23, 2013
Sold by
Brosnan Neil
Bought by
Brosnan Neil
Home Financials for this Owner
Home Financials are based on the most recent Mortgage that was taken out on this home.
Original Mortgage
$261,500
Outstanding Balance
$132,802
Interest Rate
4.08%
Mortgage Type
New Conventional
Estimated Equity
$2,127,703
Purchase Details
Closed on
Aug 13, 2003
Sold by
Brosnan Neil and Holley Brosnan Leslie
Bought by
Brosnan Neil
Home Financials for this Owner
Home Financials are based on the most recent Mortgage that was taken out on this home.
Original Mortgage
$329,000
Interest Rate
5.46%
Mortgage Type
Purchase Money Mortgage
Purchase Details
Closed on
Jan 20, 1999
Sold by
Eriks Ava
Bought by
Brosnan Neil and Holley Brosnan Leslie
Home Financials for this Owner
Home Financials are based on the most recent Mortgage that was taken out on this home.
Original Mortgage
$343,200
Interest Rate
6.63%
Create a Home Valuation Report for This Property
The Home Valuation Report is an in-depth analysis detailing your home's value as well as a comparison with similar homes in the area
Home Values in the Area
Average Home Value in this Area
Purchase History
| Date | Buyer | Sale Price | Title Company |
|---|---|---|---|
| Holley Brosnan Leslie Denise | -- | None Available | |
| Brosnan Neil | -- | None Available | |
| Brosnan Neil | -- | Alliance Title | |
| Brosnan Neil | $429,000 | North American Title Insuran |
Source: Public Records
Mortgage History
| Date | Status | Borrower | Loan Amount |
|---|---|---|---|
| Open | Brosnan Neil | $261,500 | |
| Closed | Brosnan Neil | $329,000 | |
| Closed | Brosnan Neil | $343,200 |
Source: Public Records
Tax History Compared to Growth
Tax History
| Year | Tax Paid | Tax Assessment Tax Assessment Total Assessment is a certain percentage of the fair market value that is determined by local assessors to be the total taxable value of land and additions on the property. | Land | Improvement |
|---|---|---|---|---|
| 2025 | $9,282 | $672,526 | $336,263 | $336,263 |
| 2023 | $9,282 | $646,412 | $323,206 | $323,206 |
| 2022 | $8,763 | $633,738 | $316,869 | $316,869 |
| 2021 | $8,625 | $621,312 | $310,656 | $310,656 |
| 2020 | $8,514 | $614,942 | $307,471 | $307,471 |
| 2019 | $8,316 | $602,886 | $301,443 | $301,443 |
| 2018 | $8,093 | $591,066 | $295,533 | $295,533 |
| 2017 | $7,973 | $1,315,800 | $1,137,300 | $178,500 |
| 2016 | $15,970 | $1,290,000 | $1,115,000 | $175,000 |
| 2015 | $7,767 | $559,584 | $279,792 | $279,792 |
| 2014 | $7,494 | $548,624 | $274,312 | $274,312 |
Source: Public Records
Map
Nearby Homes
- 300 Manzanita Ave
- 1667 San Carlos Ave Unit 301
- 21 Highland Ave
- 656 Cedar St Unit 3
- 1555 Cherry St Unit 12
- 520 El Camino Real Unit 307
- 657 Walnut St Unit 301
- 560 El Camino Real Unit 404
- 560 El Camino Real Unit 206
- 728 Elm St Unit 205
- 70 Ensenada Rd
- 782 Elm St Unit C
- 88 Madera Ave
- 65 Madera Ave
- 7 Chestnut St
- 39 Madera Ave
- 53 Madera Ave
- 1047 Cherry St
- 1020 Inverness Dr
- 158 Manor Dr
- 1552 Magnolia Ave
- 393 Cedar St
- 387 Cedar St
- 1544 Magnolia Ave
- 446 Chestnut St
- 381 Cedar St
- 440 Chestnut St
- 1536 Magnolia Ave
- 450 Chestnut St
- 371 Cedar St
- 430 Chestnut St
- 509 Prospect St
- 1524 Magnolia Ave
- 401 Cedar St
- 420 Prospect St
- 369 Cedar St
- 412 Cedar St
- 436 Prospect St
- 420 Chestnut St
- 1500 Magnolia Ave