Estimated Value: $410,027 - $474,000
3
Beds
2
Baths
1,362
Sq Ft
$327/Sq Ft
Est. Value
About This Home
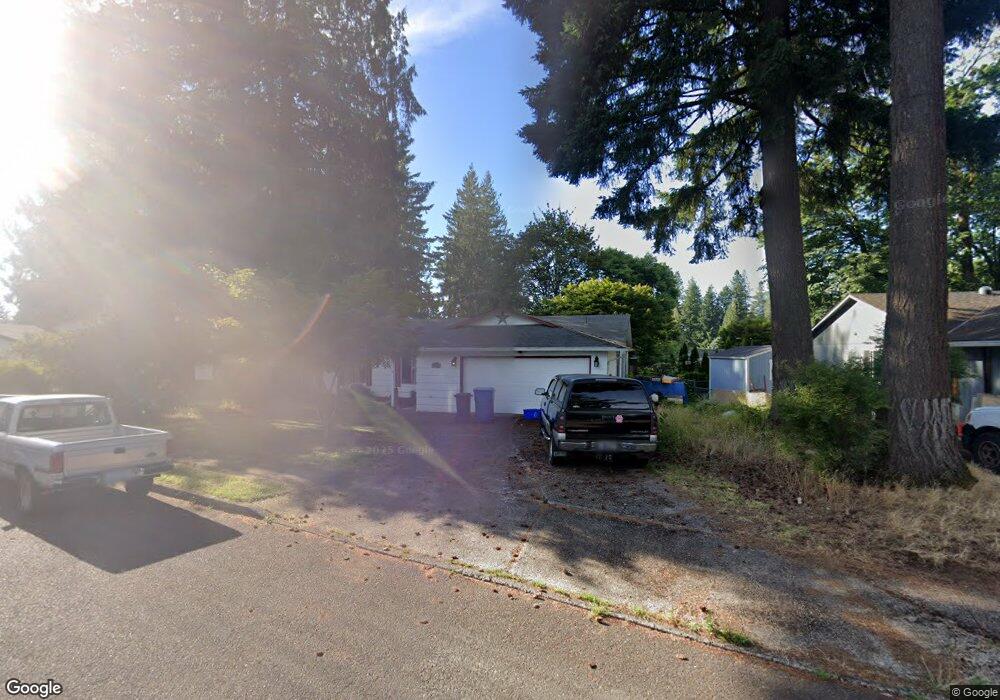
This home is located at 39925 Hall Ct, Sandy, OR 97055 and is currently estimated at $445,507, approximately $327 per square foot. 39925 Hall Ct is a home located in Clackamas County with nearby schools including Sandy Grade School, Cedar Ridge Middle School, and Sandy High School.
Ownership History
Date
Name
Owned For
Owner Type
Purchase Details
Closed on
Apr 28, 2014
Sold by
Martin Christopher R and Martin Stephanie K
Bought by
Carlberg Matthew R
Current Estimated Value
Home Financials for this Owner
Home Financials are based on the most recent Mortgage that was taken out on this home.
Original Mortgage
$204,081
Outstanding Balance
$154,745
Interest Rate
4.35%
Mortgage Type
New Conventional
Estimated Equity
$290,762
Purchase Details
Closed on
Dec 2, 2009
Sold by
Hine Tyler S
Bought by
Martin Christopher R and Martin Stephanie K
Home Financials for this Owner
Home Financials are based on the most recent Mortgage that was taken out on this home.
Original Mortgage
$194,948
Interest Rate
4.99%
Mortgage Type
New Conventional
Purchase Details
Closed on
Apr 19, 2001
Sold by
Hine Maria
Bought by
Hine Tyler S
Home Financials for this Owner
Home Financials are based on the most recent Mortgage that was taken out on this home.
Original Mortgage
$65,000
Interest Rate
6.52%
Create a Home Valuation Report for This Property
The Home Valuation Report is an in-depth analysis detailing your home's value as well as a comparison with similar homes in the area
Home Values in the Area
Average Home Value in this Area
Purchase History
| Date | Buyer | Sale Price | Title Company |
|---|---|---|---|
| Carlberg Matthew R | $200,000 | Wfg Title | |
| Martin Christopher R | $191,050 | Fidelity Natl Title Co Of Or | |
| Hine Tyler S | -- | Oregon Title Insurance Co |
Source: Public Records
Mortgage History
| Date | Status | Borrower | Loan Amount |
|---|---|---|---|
| Open | Carlberg Matthew R | $204,081 | |
| Previous Owner | Martin Christopher R | $194,948 | |
| Previous Owner | Hine Tyler S | $65,000 |
Source: Public Records
Tax History Compared to Growth
Tax History
| Year | Tax Paid | Tax Assessment Tax Assessment Total Assessment is a certain percentage of the fair market value that is determined by local assessors to be the total taxable value of land and additions on the property. | Land | Improvement |
|---|---|---|---|---|
| 2025 | $3,616 | $210,758 | -- | -- |
| 2024 | $3,463 | $204,620 | -- | -- |
| 2023 | $3,463 | $198,661 | $0 | $0 |
| 2022 | $3,281 | $192,875 | $0 | $0 |
| 2021 | $3,168 | $187,258 | $0 | $0 |
| 2020 | $3,082 | $181,804 | $0 | $0 |
| 2019 | $3,053 | $176,509 | $0 | $0 |
| 2018 | $2,967 | $171,368 | $0 | $0 |
| 2017 | $2,896 | $166,377 | $0 | $0 |
| 2016 | $2,796 | $161,531 | $0 | $0 |
| 2015 | $2,716 | $156,826 | $0 | $0 |
| 2014 | $2,645 | $152,258 | $0 | $0 |
Source: Public Records
Map
Nearby Homes
- 18050 SE Langensand Rd
- 40195 SE Highway 26
- 17675 Wolf Dr
- 18274 Antler Ave
- 18462 SE Langensand Rd
- 39784 Syblon Ln
- 39647 Pleasant St
- 39584 Wall St
- 17360 SE Ten Eyck Rd
- 18461 Meadow Ave
- 18653 Van Fleet Ave
- 39355 Glover Ct
- 17093 Hood Ct
- 0 Oregon 211
- 18712 Cloud Cap Ave
- 40510 SE Cedar Creek Rd
- 38851 Sandy Heights St
- 38766 Barlow Pkwy
- 18155 Tupper Rd
- 41057 SE Vista Loop Dr
- 40005 Hall Ct
- 39905 Hall Ct
- 40000 Davis St
- 39960 Davis St
- 39910 Hall Ct
- 40020 Hall Ct
- 39980 Davis St
- 39970 Hall Ct
- 17890 Van Fleet Ave
- 17955 Van Fleet Ave
- 40055 Davis St
- 39940 Hall Ct
- 17975 Davis St
- 17890 Davis St
- 17950 Van Fleet Ave
- 40025 Davis St
- 39940 Davis St
- 17830 Van Fleet Ave
- 18025 Weaver Ct
- 17930 Davis St