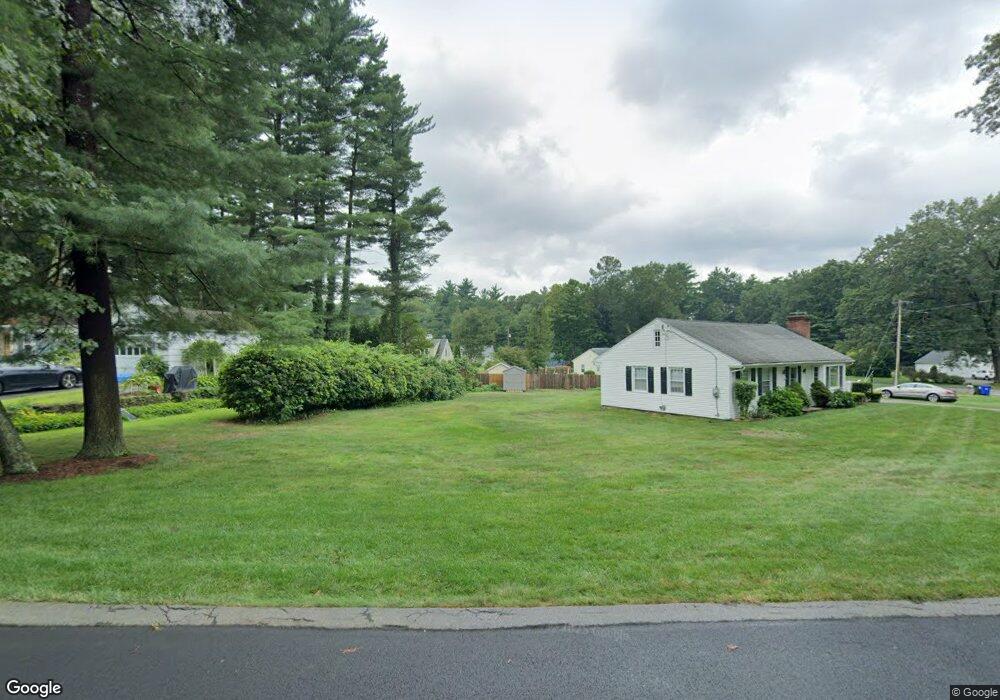
4 E Colonial Rd Wilbraham, MA 01095
Estimated Value: $358,667 - $465,000
3
Beds
1
Bath
1,148
Sq Ft
$359/Sq Ft
Est. Value
About This Home
This home is located at 4 E Colonial Rd, Wilbraham, MA 01095 and is currently estimated at $412,417, approximately $359 per square foot. 4 E Colonial Rd is a home located in Hampden County with nearby schools including Minnechaug Regional High School, Springfield International Charter School, and Pioneer Valley Montessori School.
Ownership History
Date
Name
Owned For
Owner Type
Purchase Details
Closed on
Sep 29, 2000
Sold by
Hansberry Mark T
Bought by
Jermakian David A and Jermakian Brenda M
Current Estimated Value
Home Financials for this Owner
Home Financials are based on the most recent Mortgage that was taken out on this home.
Original Mortgage
$127,900
Outstanding Balance
$44,189
Interest Rate
7.94%
Mortgage Type
Purchase Money Mortgage
Estimated Equity
$368,228
Purchase Details
Closed on
Aug 20, 1996
Sold by
Brown Marjorie and Brown Marion
Bought by
Hansberry Mark T
Home Financials for this Owner
Home Financials are based on the most recent Mortgage that was taken out on this home.
Original Mortgage
$114,000
Interest Rate
8.08%
Mortgage Type
Purchase Money Mortgage
Create a Home Valuation Report for This Property
The Home Valuation Report is an in-depth analysis detailing your home's value as well as a comparison with similar homes in the area
Home Values in the Area
Average Home Value in this Area
Purchase History
| Date | Buyer | Sale Price | Title Company |
|---|---|---|---|
| Jermakian David A | $159,900 | -- | |
| Hansberry Mark T | $120,000 | -- |
Source: Public Records
Mortgage History
| Date | Status | Borrower | Loan Amount |
|---|---|---|---|
| Open | Jermakian David A | $127,900 | |
| Previous Owner | Hansberry Mark T | $114,000 |
Source: Public Records
Tax History
| Year | Tax Paid | Tax Assessment Tax Assessment Total Assessment is a certain percentage of the fair market value that is determined by local assessors to be the total taxable value of land and additions on the property. | Land | Improvement |
|---|---|---|---|---|
| 2025 | $5,575 | $311,800 | $97,100 | $214,700 |
| 2024 | $5,580 | $301,600 | $97,100 | $204,500 |
| 2023 | $4,961 | $272,800 | $97,100 | $175,700 |
| 2022 | $4,961 | $242,100 | $97,100 | $145,000 |
| 2021 | $4,794 | $208,800 | $104,600 | $104,200 |
| 2020 | $4,673 | $208,800 | $104,600 | $104,200 |
| 2019 | $4,552 | $208,800 | $104,600 | $104,200 |
| 2018 | $4,363 | $192,700 | $104,600 | $88,100 |
| 2017 | $4,239 | $192,700 | $104,600 | $88,100 |
| 2016 | $4,223 | $195,500 | $115,900 | $79,600 |
| 2015 | $4,082 | $195,500 | $115,900 | $79,600 |
Source: Public Records
Map
Nearby Homes
- 34 Flora St
- 28 Old Lane Rd
- 6 Brooklawn Rd
- 23 Rachael St
- 15 Pine Acre Rd
- 301 Tinkham Rd
- 25 Angelica Dr
- 2306 Wilbraham Rd
- 17 Jeanne Marie St
- 60 Jeanne Marie St
- 236 Glenoak Dr
- 228 Acrebrook Rd
- 5 Edgewood Rd
- 88 Senator St
- 763 Stony Hill Rd
- 767 Stony Hill Rd
- 119 Acrebrook Rd
- 121 Mallowhill Rd
- 25 Nassau Dr Unit 25
- 173 Nassau Dr
- 6 E Colonial Rd
- 2 E Colonial Rd
- 5 W Colonial Rd
- 3 W Colonial Rd
- 7 W Colonial Rd
- 5 E Colonial Rd
- 8 E Colonial Rd
- 3 E Colonial Rd
- 7 E Colonial Rd
- 2 W Colonial Rd
- 8 W Colonial Rd
- 6 W Colonial Rd
- 4 W Colonial Rd
- 1 E Colonial Rd
- 9 W Colonial Rd
- 19 Colonial Rd
- LOT 2 W Colonial
- 20 Colonial Rd
- 31 Brookside Dr
- 4 S Colonial Rd
Your Personal Tour Guide
Ask me questions while you tour the home.