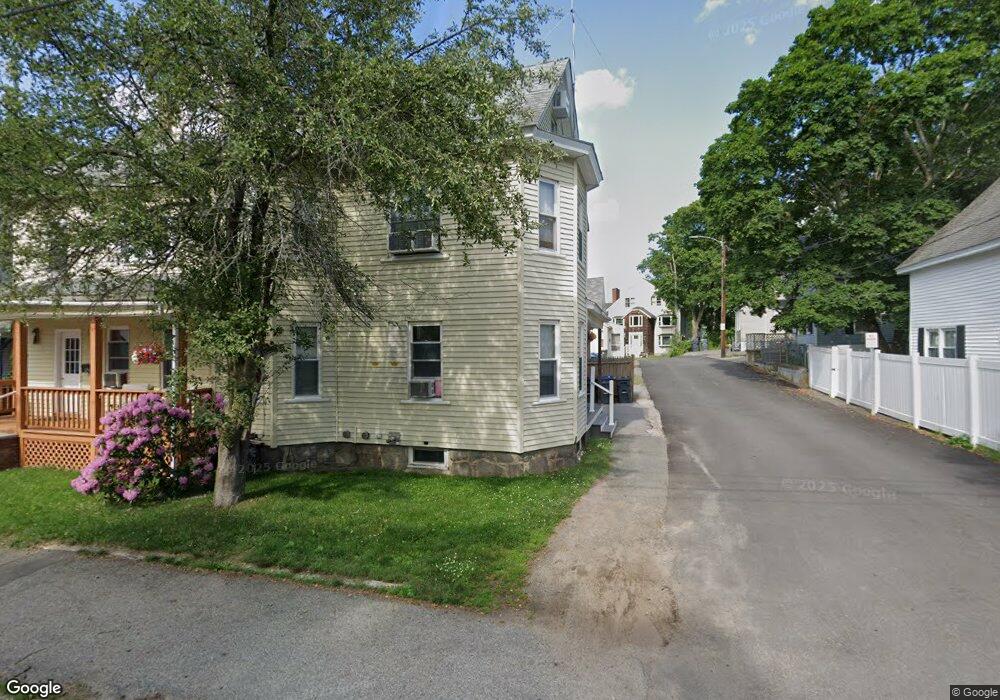
4 Richardson Ct Methuen, MA 01844
Downtown Methuen NeighborhoodEstimated Value: $368,000 - $449,452
3
Beds
1
Bath
1,122
Sq Ft
$376/Sq Ft
Est. Value
About This Home
This home is located at 4 Richardson Ct, Methuen, MA 01844 and is currently estimated at $422,113, approximately $376 per square foot. 4 Richardson Ct is a home located in Essex County with nearby schools including Mendota Elementary School, Tenney Grammar School, and South Point Elementary School.
Ownership History
Date
Name
Owned For
Owner Type
Purchase Details
Closed on
Aug 24, 2004
Sold by
Mulligan Daniel
Bought by
Mulligan Daniel and Mulligan Margaret F
Current Estimated Value
Home Financials for this Owner
Home Financials are based on the most recent Mortgage that was taken out on this home.
Original Mortgage
$140,000
Outstanding Balance
$69,070
Interest Rate
6.03%
Mortgage Type
Purchase Money Mortgage
Estimated Equity
$353,043
Purchase Details
Closed on
Jul 13, 2000
Sold by
Morrow Del C and Morrow Donna M
Bought by
Mulligan Daniel
Home Financials for this Owner
Home Financials are based on the most recent Mortgage that was taken out on this home.
Original Mortgage
$118,439
Interest Rate
8.5%
Mortgage Type
Purchase Money Mortgage
Purchase Details
Closed on
Sep 18, 1987
Sold by
Hickey Marcella
Bought by
Morrow Del
Create a Home Valuation Report for This Property
The Home Valuation Report is an in-depth analysis detailing your home's value as well as a comparison with similar homes in the area
Home Values in the Area
Average Home Value in this Area
Purchase History
| Date | Buyer | Sale Price | Title Company |
|---|---|---|---|
| Mulligan Daniel | -- | -- | |
| Mulligan Daniel | -- | -- | |
| Mulligan Daniel | $118,500 | -- | |
| Mulligan Daniel | $118,500 | -- | |
| Morrow Del | $100,000 | -- |
Source: Public Records
Mortgage History
| Date | Status | Borrower | Loan Amount |
|---|---|---|---|
| Open | Mulligan Daniel | $140,000 | |
| Closed | Morrow Del | $140,000 | |
| Previous Owner | Morrow Del | $118,439 | |
| Previous Owner | Morrow Del | $95,500 |
Source: Public Records
Tax History Compared to Growth
Tax History
| Year | Tax Paid | Tax Assessment Tax Assessment Total Assessment is a certain percentage of the fair market value that is determined by local assessors to be the total taxable value of land and additions on the property. | Land | Improvement |
|---|---|---|---|---|
| 2025 | $3,899 | $368,500 | $169,800 | $198,700 |
| 2024 | $3,785 | $348,500 | $154,900 | $193,600 |
| 2023 | $3,639 | $311,000 | $137,700 | $173,300 |
| 2022 | $3,355 | $257,100 | $109,000 | $148,100 |
| 2021 | $3,154 | $239,100 | $103,200 | $135,900 |
| 2020 | $3,133 | $233,100 | $103,200 | $129,900 |
| 2019 | $2,693 | $189,800 | $73,100 | $116,700 |
| 2018 | $2,566 | $179,800 | $68,800 | $111,000 |
| 2017 | $2,485 | $169,600 | $68,800 | $100,800 |
| 2016 | $2,355 | $159,000 | $60,200 | $98,800 |
| 2015 | $2,263 | $155,000 | $60,200 | $94,800 |
Source: Public Records
Map
Nearby Homes
- 47 Lowell St
- 83 Arnold St
- 197 Oakland Ave
- 190-192 Oakland Ave
- 20-22 Ashland Ave
- 24 Railroad St
- 17-19 Maplewood Ave
- 37 Maplewood Ave
- 26 Gage St
- 52 High St Unit 5
- 32 Morrison Ct
- 2 Horne St
- 35 Hardy St
- 23 Chase St
- 69 Broadway
- 100-102 Phillips St
- 18 Larchwood Rd
- 8 Francella Rd
- 48 Larchwood Rd
- 65 Clayton Ave
- 12 1/2 Barker St
- 8 Richardson Ct
- 10 Barker St Unit 2
- 10 Barker St Unit 12
- 3 Richardson Ct
- 5 Richardson Ct
- 7 Richardson Ct
- 7 Richardson Ct Unit 7
- 8 Barker St
- 8 Barker St Unit 2
- 14 Barker St
- 16 Barker St
- 10 Richardson Ct
- 11 Barker St
- 15 Barker St
- 7 Barker St
- 17 Barker St
- 4 Barker St
- 57 Lowell St
- 5 Barker St