Estimated Value: $1,501,534 - $1,757,000
4
Beds
2
Baths
1,677
Sq Ft
$977/Sq Ft
Est. Value
About This Home
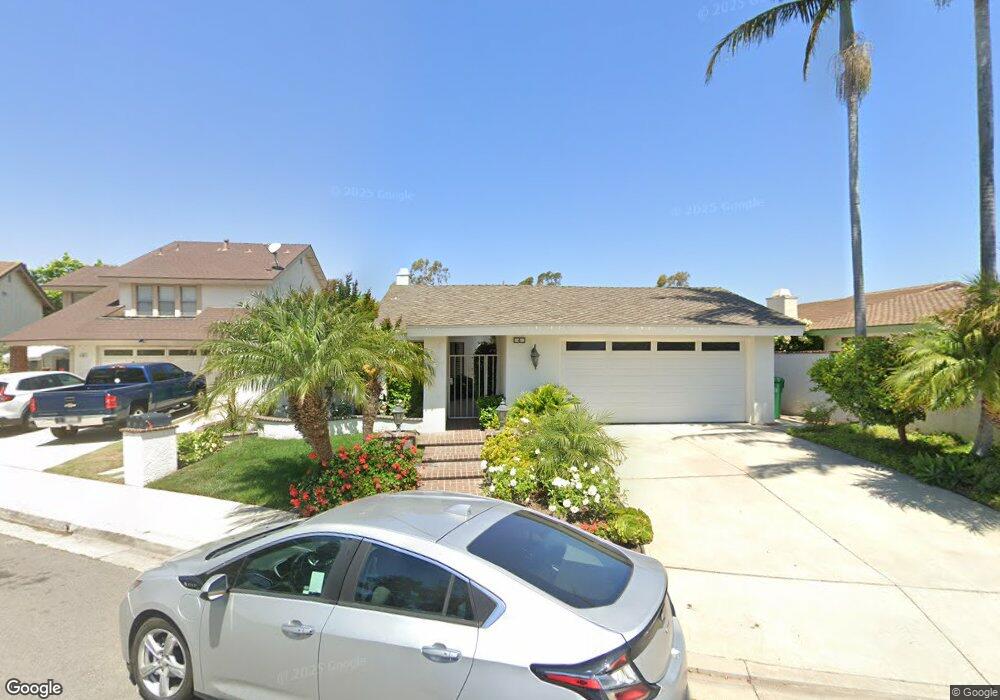
This home is located at 4 Ross, Irvine, CA 92620 and is currently estimated at $1,638,634, approximately $977 per square foot. 4 Ross is a home located in Orange County with nearby schools including Northwood Elementary School, Sierra Vista Middle School, and Northwood High School.
Ownership History
Date
Name
Owned For
Owner Type
Purchase Details
Closed on
Jun 18, 2024
Sold by
Porteous Teri L
Bought by
Terri Lynn Porteous Living Trust and Porteous
Current Estimated Value
Purchase Details
Closed on
Jan 10, 2003
Sold by
Porteous Teri L
Bought by
Porteous Teri L
Home Financials for this Owner
Home Financials are based on the most recent Mortgage that was taken out on this home.
Original Mortgage
$235,000
Interest Rate
5.96%
Mortgage Type
Stand Alone First
Purchase Details
Closed on
Feb 17, 1999
Sold by
Porteous Brianjames R
Bought by
Porteous Teri L
Create a Home Valuation Report for This Property
The Home Valuation Report is an in-depth analysis detailing your home's value as well as a comparison with similar homes in the area
Home Values in the Area
Average Home Value in this Area
Purchase History
| Date | Buyer | Sale Price | Title Company |
|---|---|---|---|
| Terri Lynn Porteous Living Trust | -- | None Listed On Document | |
| Porteous Teri L | -- | First American Title Co | |
| Porteous Teri L | -- | -- |
Source: Public Records
Mortgage History
| Date | Status | Borrower | Loan Amount |
|---|---|---|---|
| Previous Owner | Porteous Teri L | $235,000 |
Source: Public Records
Tax History
| Year | Tax Paid | Tax Assessment Tax Assessment Total Assessment is a certain percentage of the fair market value that is determined by local assessors to be the total taxable value of land and additions on the property. | Land | Improvement |
|---|---|---|---|---|
| 2025 | $2,860 | $266,992 | $87,958 | $179,034 |
| 2024 | $2,860 | $261,757 | $86,233 | $175,524 |
| 2023 | $2,784 | $256,625 | $84,542 | $172,083 |
| 2022 | $2,724 | $251,594 | $82,885 | $168,709 |
| 2021 | $2,658 | $246,661 | $81,260 | $165,401 |
| 2020 | $2,642 | $244,132 | $80,426 | $163,706 |
| 2019 | $2,582 | $239,346 | $78,849 | $160,497 |
| 2018 | $2,533 | $234,653 | $77,303 | $157,350 |
| 2017 | $2,479 | $230,052 | $75,787 | $154,265 |
| 2016 | $2,373 | $225,542 | $74,301 | $151,241 |
| 2015 | $2,337 | $222,155 | $73,185 | $148,970 |
| 2014 | $2,292 | $217,804 | $71,752 | $146,052 |
Source: Public Records
Map
Nearby Homes
- 4 Carson
- 6 Gettysburg
- 30 Jefferson
- 66 Bridgeport
- 65 Remington Unit 232
- 30 Remington
- 73 Huntington Unit 322
- 22 Hunter
- 22 Yorktown
- 83 Huntington Unit 278
- 127 Huntington Unit 257
- 25 Bennington
- 26 Helena Unit 69
- 84 Jade Flower
- 27 Torrey Pine
- 305 Huntington
- 10 Santa fe Unit 38
- 54 Shadowplay
- 4062 Escudero Dr
- 10 Raleigh
Your Personal Tour Guide
Ask me questions while you tour the home.