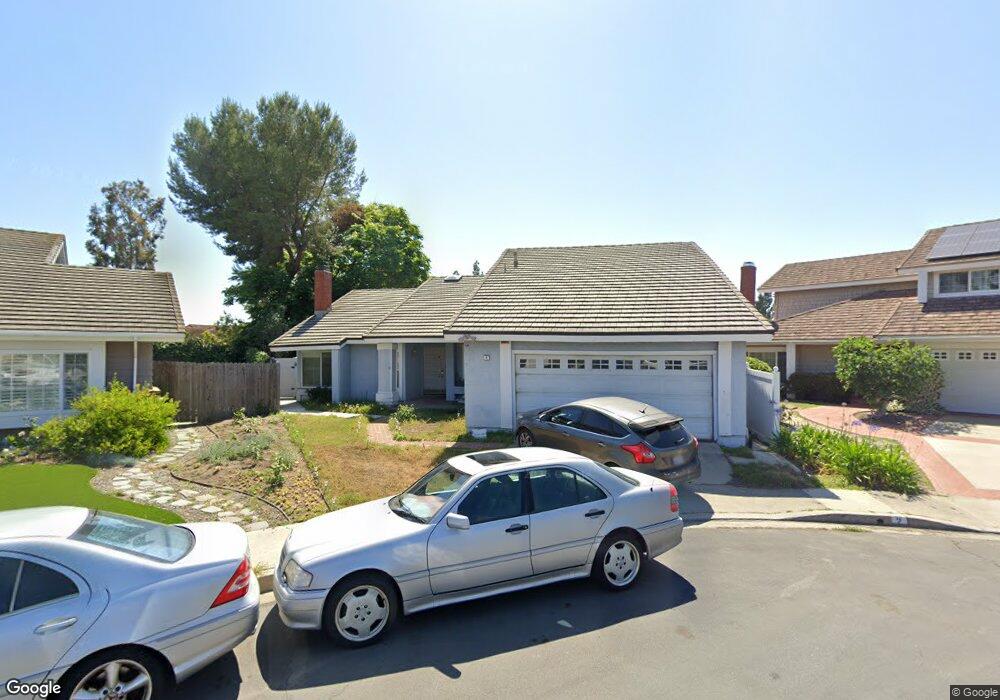
4 Stonewall Irvine, CA 92620
Northwood NeighborhoodEstimated Value: $1,705,000 - $1,753,000
3
Beds
2
Baths
1,809
Sq Ft
$954/Sq Ft
Est. Value
About This Home
This home is located at 4 Stonewall, Irvine, CA 92620 and is currently estimated at $1,726,508, approximately $954 per square foot. 4 Stonewall is a home located in Orange County with nearby schools including Brywood Elementary School, Sierra Vista Middle School, and Northwood High School.
Ownership History
Date
Name
Owned For
Owner Type
Purchase Details
Closed on
Nov 17, 2004
Sold by
Rhamadi Michael
Bought by
Khandan Behnaz
Current Estimated Value
Home Financials for this Owner
Home Financials are based on the most recent Mortgage that was taken out on this home.
Original Mortgage
$556,000
Outstanding Balance
$290,666
Interest Rate
6.5%
Mortgage Type
Purchase Money Mortgage
Estimated Equity
$1,435,842
Purchase Details
Closed on
Oct 26, 2004
Sold by
Levasseur Christopher S and Levasseur Michelle A
Bought by
Khandan Behnaz
Home Financials for this Owner
Home Financials are based on the most recent Mortgage that was taken out on this home.
Original Mortgage
$556,000
Outstanding Balance
$290,666
Interest Rate
6.5%
Mortgage Type
Purchase Money Mortgage
Estimated Equity
$1,435,842
Purchase Details
Closed on
Jul 22, 2003
Sold by
Chi John and Huang Patty
Bought by
Levasseur Christopher S and Levasseur Michelle A
Home Financials for this Owner
Home Financials are based on the most recent Mortgage that was taken out on this home.
Original Mortgage
$430,000
Interest Rate
5.15%
Mortgage Type
Purchase Money Mortgage
Purchase Details
Closed on
May 14, 1998
Sold by
Patty Huang
Bought by
Chi John and Huang Patty
Purchase Details
Closed on
Mar 4, 1998
Sold by
John Chi
Bought by
Huang Patty
Home Financials for this Owner
Home Financials are based on the most recent Mortgage that was taken out on this home.
Original Mortgage
$186,000
Interest Rate
7.13%
Purchase Details
Closed on
Apr 8, 1994
Sold by
Huang Patty
Bought by
Chi John and Huang Patty
Purchase Details
Closed on
Dec 9, 1993
Sold by
Chi John
Bought by
Huang Patty
Home Financials for this Owner
Home Financials are based on the most recent Mortgage that was taken out on this home.
Original Mortgage
$194,400
Interest Rate
7.2%
Purchase Details
Closed on
Nov 5, 1993
Sold by
Betschart Bruce S and Betschart Julie Ann
Bought by
Huang Petty
Home Financials for this Owner
Home Financials are based on the most recent Mortgage that was taken out on this home.
Original Mortgage
$194,400
Interest Rate
7.2%
Create a Home Valuation Report for This Property
The Home Valuation Report is an in-depth analysis detailing your home's value as well as a comparison with similar homes in the area
Home Values in the Area
Average Home Value in this Area
Purchase History
| Date | Buyer | Sale Price | Title Company |
|---|---|---|---|
| Khandan Behnaz | -- | California Title | |
| Khandan Behnaz | $695,000 | California Title | |
| Levasseur Christopher S | $556,000 | Equity Title | |
| Chi John | -- | -- | |
| Huang Patty | -- | Chicago Title Insurance Co | |
| Chi John | -- | -- | |
| Huang Patty | -- | Chicago Title Company | |
| Huang Petty | $243,000 | Chicago Title Company |
Source: Public Records
Mortgage History
| Date | Status | Borrower | Loan Amount |
|---|---|---|---|
| Open | Khandan Behnaz | $556,000 | |
| Previous Owner | Levasseur Christopher S | $430,000 | |
| Previous Owner | Huang Patty | $186,000 | |
| Previous Owner | Huang Petty | $194,400 | |
| Closed | Khandan Behnaz | $69,500 |
Source: Public Records
Tax History
| Year | Tax Paid | Tax Assessment Tax Assessment Total Assessment is a certain percentage of the fair market value that is determined by local assessors to be the total taxable value of land and additions on the property. | Land | Improvement |
|---|---|---|---|---|
| 2025 | $9,934 | $957,818 | $797,900 | $159,918 |
| 2024 | $9,934 | $939,038 | $782,255 | $156,783 |
| 2023 | $9,678 | $920,626 | $766,917 | $153,709 |
| 2022 | $9,497 | $902,575 | $751,879 | $150,696 |
| 2021 | $9,282 | $884,878 | $737,136 | $147,742 |
| 2020 | $9,230 | $875,805 | $729,577 | $146,228 |
| 2019 | $9,026 | $858,633 | $715,272 | $143,361 |
| 2018 | $8,869 | $841,798 | $701,248 | $140,550 |
| 2017 | $8,686 | $825,293 | $687,498 | $137,795 |
| 2016 | $8,038 | $783,000 | $663,630 | $119,370 |
| 2015 | $8,036 | $783,000 | $663,630 | $119,370 |
| 2014 | $7,189 | $698,759 | $579,389 | $119,370 |
Source: Public Records
Map
Nearby Homes
Your Personal Tour Guide
Ask me questions while you tour the home.