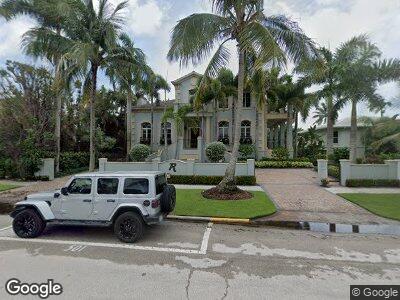
40 5th Ave S Unit 5 Naples, FL 34102
Old Naples NeighborhoodEstimated Value: $7,032,000 - $12,828,115
--
Bed
7
Baths
4,083
Sq Ft
$2,432/Sq Ft
Est. Value
About This Home
This home is located at 40 5th Ave S Unit 5, Naples, FL 34102 and is currently estimated at $9,930,058, approximately $2,432 per square foot. 40 5th Ave S Unit 5 is a home located in Collier County with nearby schools including Lake Park Elementary School, Naples High School, and Gulfview Middle School.
Ownership History
Date
Name
Owned For
Owner Type
Purchase Details
Closed on
Jan 10, 2020
Sold by
Ricker Jay B and Ricker Nancy S
Bought by
Ricker Jay B and Ricker Nancy S
Current Estimated Value
Purchase Details
Closed on
Sep 25, 2019
Sold by
Wolfe Ann Isaly
Bought by
Ricker Jay B and Ricker Nancy S
Purchase Details
Closed on
Apr 26, 2004
Sold by
Holton Donald I and Holton Elizabeth
Bought by
Wolfe John F and Wolfe Ann Isaly
Purchase Details
Closed on
Mar 23, 1999
Sold by
Andrew Edith G
Bought by
Holton Donald I and Holton Elizabeth
Purchase Details
Closed on
May 29, 1997
Sold by
Holzberg J Fritz and Holzberg Elfreida
Bought by
Andrew Edith G
Home Financials for this Owner
Home Financials are based on the most recent Mortgage that was taken out on this home.
Original Mortgage
$835,000
Interest Rate
8.13%
Purchase Details
Closed on
May 28, 1997
Sold by
Pallodino Lori and Holzberg Lori Ann
Bought by
Andrew Edith G
Home Financials for this Owner
Home Financials are based on the most recent Mortgage that was taken out on this home.
Original Mortgage
$835,000
Interest Rate
8.13%
Create a Home Valuation Report for This Property
The Home Valuation Report is an in-depth analysis detailing your home's value as well as a comparison with similar homes in the area
Home Values in the Area
Average Home Value in this Area
Purchase History
| Date | Buyer | Sale Price | Title Company |
|---|---|---|---|
| Ricker Jay B | -- | Attorney | |
| Ricker Jay B | $6,175,000 | None Available | |
| Wolfe John F | $5,550,000 | -- | |
| Holton Donald I | $975,000 | -- | |
| Andrew Edith G | -- | -- | |
| Andrew Edith G | -- | -- |
Source: Public Records
Mortgage History
| Date | Status | Borrower | Loan Amount |
|---|---|---|---|
| Previous Owner | Andrew Edith G | $835,000 |
Source: Public Records
Tax History Compared to Growth
Tax History
| Year | Tax Paid | Tax Assessment Tax Assessment Total Assessment is a certain percentage of the fair market value that is determined by local assessors to be the total taxable value of land and additions on the property. | Land | Improvement |
|---|---|---|---|---|
| 2023 | $91,250 | $7,498,688 | $0 | $0 |
| 2022 | $84,735 | $6,816,989 | $0 | $0 |
| 2021 | $73,403 | $6,197,263 | $0 | $0 |
| 2020 | $57,454 | $5,659,628 | $2,885,493 | $2,774,135 |
| 2019 | $60,394 | $5,884,527 | $3,069,673 | $2,814,854 |
| 2018 | $57,407 | $5,603,768 | $3,145,000 | $2,458,768 |
| 2017 | $55,730 | $5,408,851 | $3,213,000 | $2,195,851 |
| 2016 | $64,644 | $6,058,184 | $0 | $0 |
| 2015 | $66,020 | $5,507,440 | $0 | $0 |
| 2014 | $55,497 | $5,006,764 | $0 | $0 |
Source: Public Records
Map
Nearby Homes
- 40 5th Ave S Unit 5
- 526 Gulf Shore Blvd S
- 20 5th Ave S
- 73 6th Ave S
- 19 6th Ave S
- 87 6th Ave S
- 25 5th Ave S Unit 13
- 470 Gulf Shore Bght S
- 120 5th Ave S
- 460 Gulf Shore Blvd S
- 577 Gulf Shore Blvd S
- 450 Gulf Shore Blvd S
- 18 6th Ave S
- 50 6th Ave S
- 140 5th Ave S
- 76 6th Ave S
- 0 4th Ave SE Unit 218020026
- 0 4th Ave SE Unit 217009595
- 0 4th Ave SE Unit 260679
- 0 4th Ave SE Unit 222034021