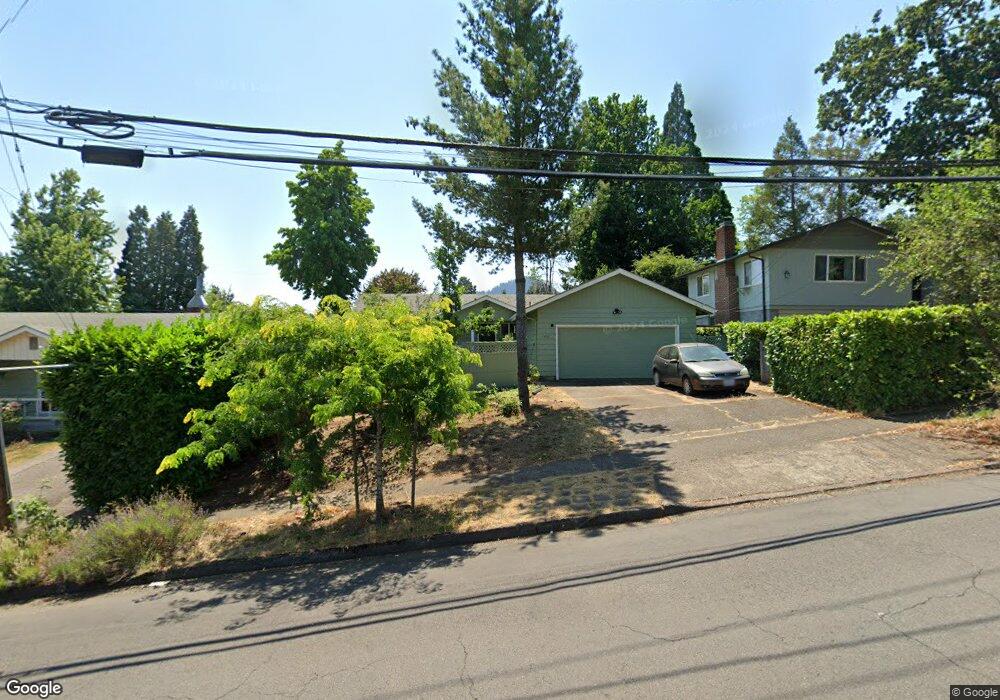
40 E 40th Ave Eugene, OR 97405
Southeast Eugene NeighborhoodEstimated Value: $436,000 - $454,000
3
Beds
1
Bath
1,164
Sq Ft
$380/Sq Ft
Est. Value
About This Home
This home is located at 40 E 40th Ave, Eugene, OR 97405 and is currently estimated at $442,549, approximately $380 per square foot. 40 E 40th Ave is a home located in Lane County with nearby schools including Edgewood Community Elementary School, Spencer Butte Middle School, and South Eugene High School.
Ownership History
Date
Name
Owned For
Owner Type
Purchase Details
Closed on
Mar 17, 2014
Sold by
Jones Eric S
Bought by
Jones Eric S and Sizemore Theresa J
Current Estimated Value
Home Financials for this Owner
Home Financials are based on the most recent Mortgage that was taken out on this home.
Original Mortgage
$129,270
Outstanding Balance
$37,125
Interest Rate
4.29%
Mortgage Type
New Conventional
Estimated Equity
$405,424
Purchase Details
Closed on
Apr 12, 2005
Sold by
Richardson Harlean J
Bought by
Jones Eric S
Home Financials for this Owner
Home Financials are based on the most recent Mortgage that was taken out on this home.
Original Mortgage
$145,600
Interest Rate
5.77%
Mortgage Type
Purchase Money Mortgage
Purchase Details
Closed on
Jun 11, 1999
Sold by
Cekay Allen Mary E
Bought by
Richardson Harlean J
Create a Home Valuation Report for This Property
The Home Valuation Report is an in-depth analysis detailing your home's value as well as a comparison with similar homes in the area
Home Values in the Area
Average Home Value in this Area
Purchase History
| Date | Buyer | Sale Price | Title Company |
|---|---|---|---|
| Jones Eric S | -- | Western Title & Escrow Co | |
| Jones Eric S | $182,000 | Cascade Title Co | |
| Richardson Harlean J | $118,600 | Western Pioneer Title Co |
Source: Public Records
Mortgage History
| Date | Status | Borrower | Loan Amount |
|---|---|---|---|
| Open | Jones Eric S | $129,270 | |
| Closed | Jones Eric S | $145,600 |
Source: Public Records
Tax History
| Year | Tax Paid | Tax Assessment Tax Assessment Total Assessment is a certain percentage of the fair market value that is determined by local assessors to be the total taxable value of land and additions on the property. | Land | Improvement |
|---|---|---|---|---|
| 2025 | $3,807 | $195,405 | -- | -- |
| 2024 | $3,760 | $189,714 | -- | -- |
| 2023 | $3,760 | $184,189 | $0 | $0 |
| 2022 | $3,522 | $178,825 | $0 | $0 |
| 2021 | $3,308 | $173,617 | $0 | $0 |
| 2020 | $3,320 | $168,561 | $0 | $0 |
| 2019 | $3,207 | $163,652 | $0 | $0 |
| 2018 | $3,018 | $154,258 | $0 | $0 |
| 2017 | $2,883 | $154,258 | $0 | $0 |
| 2016 | $2,812 | $149,765 | $0 | $0 |
| 2015 | $2,731 | $145,403 | $0 | $0 |
| 2014 | $2,676 | $141,168 | $0 | $0 |
Source: Public Records
Map
Nearby Homes
- 170 E 40th Ave
- 4023 Donald St Unit K
- 275 E 39th Ave
- 434 E 39th Ave
- 17 Westbrook Way
- 21 Westbrook Way
- 4295 Ferry St
- 36 Westbrook Way
- 320 Dellwood Dr
- 0 E 39th Ave
- 75 W 35th Place
- 4734 Brookwood St
- 278 Rockridge Ct
- 357 W 37th Ave
- 4425 Hilyard St
- 3593 Lawrence St
- 4845 Brookwood St
- 453 Dellwood Dr
- 555 Stafford Ct
- 4320 Fox Hollow Rd
Your Personal Tour Guide
Ask me questions while you tour the home.