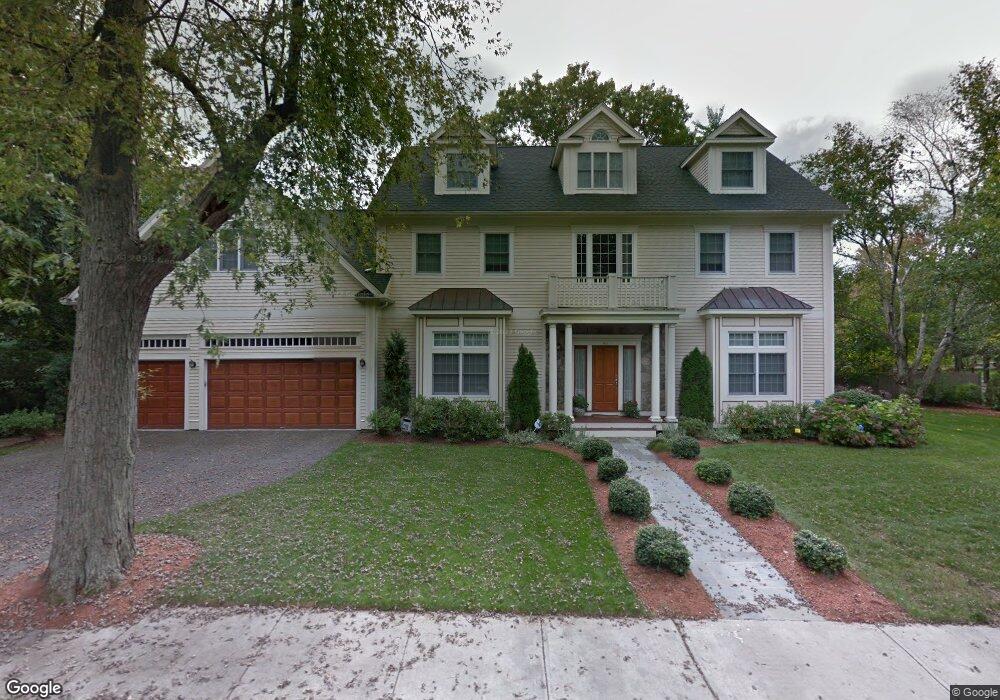
40 Moffat Rd Waban, MA 02468
Waban NeighborhoodEstimated Value: $3,375,634 - $3,894,000
6
Beds
6
Baths
4,919
Sq Ft
$750/Sq Ft
Est. Value
About This Home
This home is located at 40 Moffat Rd, Waban, MA 02468 and is currently estimated at $3,688,211, approximately $749 per square foot. 40 Moffat Rd is a home located in Middlesex County with nearby schools including Angier Elementary School, Charles E Brown Middle School, and Newton South High School.
Ownership History
Date
Name
Owned For
Owner Type
Purchase Details
Closed on
Nov 7, 2007
Sold by
Peninsula Home Bldrs I
Bought by
Gupta Kamal and Gupta Sunil
Current Estimated Value
Home Financials for this Owner
Home Financials are based on the most recent Mortgage that was taken out on this home.
Original Mortgage
$1
Interest Rate
6.47%
Purchase Details
Closed on
Mar 26, 2007
Sold by
Au Pamela Y
Bought by
Au Tr Pamela and Leung Philip
Create a Home Valuation Report for This Property
The Home Valuation Report is an in-depth analysis detailing your home's value as well as a comparison with similar homes in the area
Home Values in the Area
Average Home Value in this Area
Purchase History
| Date | Buyer | Sale Price | Title Company |
|---|---|---|---|
| Gupta Kamal | $2,275,000 | -- | |
| Peninsula Home Bldrs I | -- | -- | |
| Au Tr Pamela | -- | -- | |
| Gupta Kamal | $2,275,000 | -- | |
| Au Tr Pamela | -- | -- |
Source: Public Records
Mortgage History
| Date | Status | Borrower | Loan Amount |
|---|---|---|---|
| Open | Au Tr Pamela | $440,000 | |
| Closed | Gupta Kamal | $1 |
Source: Public Records
Tax History
| Year | Tax Paid | Tax Assessment Tax Assessment Total Assessment is a certain percentage of the fair market value that is determined by local assessors to be the total taxable value of land and additions on the property. | Land | Improvement |
|---|---|---|---|---|
| 2025 | $32,549 | $3,321,300 | $1,275,700 | $2,045,600 |
| 2024 | $31,472 | $3,224,600 | $1,238,500 | $1,986,100 |
| 2023 | $31,035 | $3,048,600 | $964,200 | $2,084,400 |
| 2022 | $29,696 | $2,822,800 | $892,800 | $1,930,000 |
| 2021 | $11,068 | $2,923,800 | $842,300 | $2,081,500 |
| 2020 | $30,524 | $2,923,800 | $842,300 | $2,081,500 |
| 2019 | $29,663 | $2,838,600 | $817,800 | $2,020,800 |
| 2018 | $29,193 | $2,698,100 | $738,300 | $1,959,800 |
| 2017 | $24,691 | $2,545,400 | $696,500 | $1,848,900 |
| 2016 | $27,072 | $2,378,900 | $650,900 | $1,728,000 |
| 2015 | $25,813 | $2,223,300 | $608,300 | $1,615,000 |
Source: Public Records
Map
Nearby Homes
- 18 Moffat Rd
- 15 Gammons Rd
- 19 Gordon Rd
- 115 Windsor Rd
- 1438 Beacon St
- 110 Avalon Rd
- 81 Fuller St
- 55 Evelyn Rd
- 155 Paulson Rd
- 32 Pickwick Rd
- 20 Kinmonth Rd Unit 203
- 20 Kinmonth Rd Unit 306
- 20 Kinmonth Rd Unit 4
- 36 Troy Ln
- 34 Larchmont Ave
- 126 Beethoven Ave
- 1230 Commonwealth Ave
- 18 Annawan Rd
- 20 Risley Rd
- 1242 Beacon St Unit 1242
Your Personal Tour Guide
Ask me questions while you tour the home.