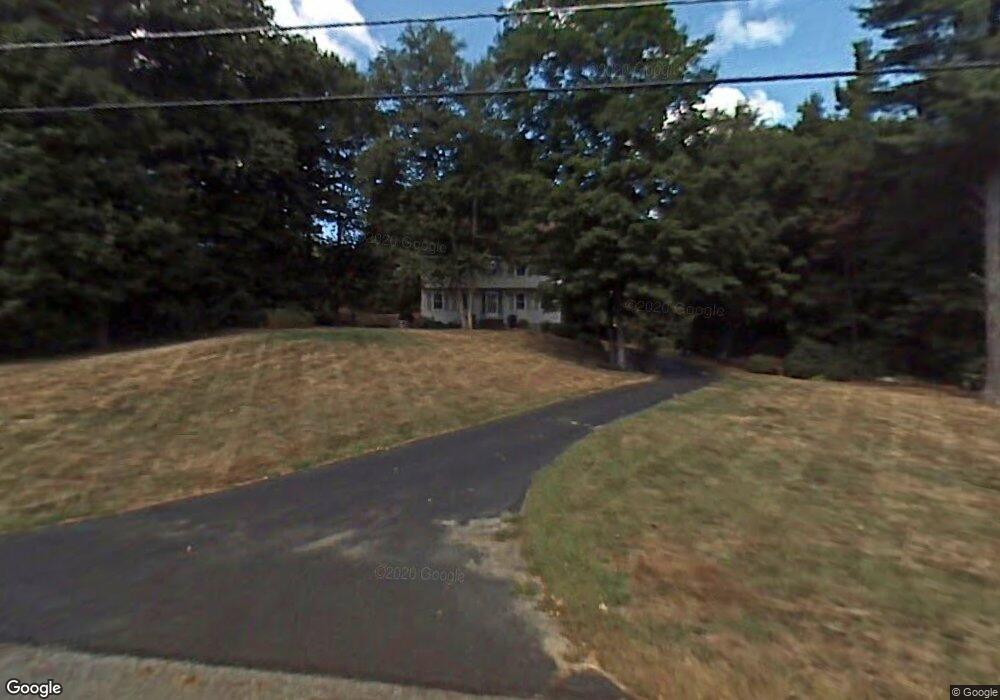
40 Quail Run Hampstead, NH 03841
Estimated Value: $665,000 - $787,000
4
Beds
3
Baths
2,298
Sq Ft
$307/Sq Ft
Est. Value
About This Home
This home is located at 40 Quail Run, Hampstead, NH 03841 and is currently estimated at $705,780, approximately $307 per square foot. 40 Quail Run is a home located in Rockingham County with nearby schools including Hampstead Central School, Hampstead Middle School, and Pinkerton Academy.
Ownership History
Date
Name
Owned For
Owner Type
Purchase Details
Closed on
Apr 5, 2010
Sold by
Roux Francis W and Roux Julie C
Bought by
Hutchings Tara
Current Estimated Value
Home Financials for this Owner
Home Financials are based on the most recent Mortgage that was taken out on this home.
Original Mortgage
$333,841
Outstanding Balance
$221,688
Interest Rate
4.94%
Mortgage Type
Purchase Money Mortgage
Estimated Equity
$484,093
Purchase Details
Closed on
Mar 28, 2003
Sold by
Wolfe Robert J and Wolfe Michele M
Bought by
Roux Julie C and Roux Francis W
Home Financials for this Owner
Home Financials are based on the most recent Mortgage that was taken out on this home.
Original Mortgage
$273,600
Interest Rate
5.91%
Purchase Details
Closed on
Oct 1, 1997
Sold by
Norris J Kevan and Norris Carolyn
Bought by
Wolfe Robert J
Home Financials for this Owner
Home Financials are based on the most recent Mortgage that was taken out on this home.
Original Mortgage
$148,800
Interest Rate
7.41%
Create a Home Valuation Report for This Property
The Home Valuation Report is an in-depth analysis detailing your home's value as well as a comparison with similar homes in the area
Home Values in the Area
Average Home Value in this Area
Purchase History
| Date | Buyer | Sale Price | Title Company |
|---|---|---|---|
| Hutchings Tara | $340,000 | -- | |
| Roux Julie C | $342,500 | -- | |
| Wolfe Robert J | $186,000 | -- |
Source: Public Records
Mortgage History
| Date | Status | Borrower | Loan Amount |
|---|---|---|---|
| Open | Wolfe Robert J | $333,841 | |
| Previous Owner | Wolfe Robert J | $273,600 | |
| Previous Owner | Wolfe Robert J | $148,800 |
Source: Public Records
Tax History Compared to Growth
Tax History
| Year | Tax Paid | Tax Assessment Tax Assessment Total Assessment is a certain percentage of the fair market value that is determined by local assessors to be the total taxable value of land and additions on the property. | Land | Improvement |
|---|---|---|---|---|
| 2024 | $11,499 | $620,200 | $243,600 | $376,600 |
| 2023 | $10,168 | $399,700 | $174,000 | $225,700 |
| 2022 | $9,465 | $399,700 | $174,000 | $225,700 |
| 2021 | $8,993 | $395,300 | $174,000 | $221,300 |
| 2020 | $8,519 | $395,300 | $174,000 | $221,300 |
| 2016 | $7,565 | $312,600 | $110,500 | $202,100 |
| 2015 | $7,164 | $319,400 | $110,500 | $208,900 |
| 2014 | $7,164 | $319,400 | $110,500 | $208,900 |
| 2006 | $6,311 | $348,300 | $132,000 | $216,300 |
Source: Public Records
Map
Nearby Homes
- 35 Kelly Brook Ln
- Lot 11 Crown Hill Rd
- 19 Crown Hill Rd
- 333 Main St
- 14 Meredith Dr
- 132 Maple Ave
- 6 Russett Ln
- 15 Cambridge Rd
- 93 Stage Rd
- 1 Remington Dr Unit 904C
- 5 Amberwood Dr
- 22 Knightland Rd
- 25 Cottonwood Rd
- 267 Main St
- 4 Huckleberry Ln
- 7 Stevens Ct Unit 7
- 7 Stevens Ct
- 127 Cowbell Crossing
- 3 Knightland Rd
- 12 Stage Rd