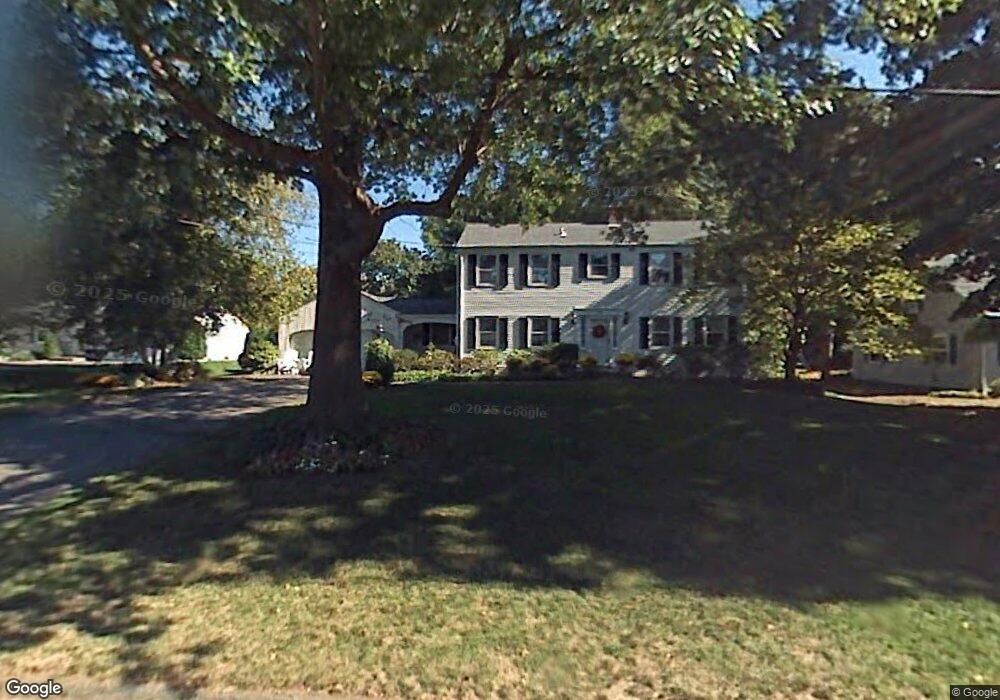
40 Randy Ln Wethersfield, CT 06109
Estimated Value: $508,457 - $621,000
4
Beds
3
Baths
1,924
Sq Ft
$286/Sq Ft
Est. Value
About This Home
This home is located at 40 Randy Ln, Wethersfield, CT 06109 and is currently estimated at $551,114, approximately $286 per square foot. 40 Randy Ln is a home located in Hartford County with nearby schools including Highcrest School, Silas Deane Middle School, and Wethersfield High School.
Ownership History
Date
Name
Owned For
Owner Type
Purchase Details
Closed on
Aug 30, 2004
Sold by
Magennis James A
Bought by
Wall-Galvin Alana
Current Estimated Value
Home Financials for this Owner
Home Financials are based on the most recent Mortgage that was taken out on this home.
Original Mortgage
$308,000
Interest Rate
6.02%
Create a Home Valuation Report for This Property
The Home Valuation Report is an in-depth analysis detailing your home's value as well as a comparison with similar homes in the area
Home Values in the Area
Average Home Value in this Area
Purchase History
| Date | Buyer | Sale Price | Title Company |
|---|---|---|---|
| Wall-Galvin Alana | $385,000 | -- |
Source: Public Records
Mortgage History
| Date | Status | Borrower | Loan Amount |
|---|---|---|---|
| Open | Wall-Galvin Alana | $282,029 | |
| Closed | Wall-Galvin Alana | $308,000 | |
| Closed | Wall-Galvin Alana | $57,000 |
Source: Public Records
Tax History
| Year | Tax Paid | Tax Assessment Tax Assessment Total Assessment is a certain percentage of the fair market value that is determined by local assessors to be the total taxable value of land and additions on the property. | Land | Improvement |
|---|---|---|---|---|
| 2025 | $12,901 | $312,990 | $106,580 | $206,410 |
| 2024 | $8,866 | $205,140 | $79,890 | $125,250 |
| 2023 | $8,571 | $205,140 | $79,890 | $125,250 |
| 2022 | $8,427 | $205,140 | $79,890 | $125,250 |
| 2021 | $8,343 | $205,140 | $79,890 | $125,250 |
| 2020 | $8,347 | $205,140 | $79,890 | $125,250 |
| 2019 | $8,357 | $205,140 | $79,890 | $125,250 |
| 2018 | $8,335 | $204,400 | $78,100 | $126,300 |
| 2017 | $8,129 | $204,400 | $78,100 | $126,300 |
| 2016 | $7,878 | $204,400 | $78,100 | $126,300 |
| 2015 | $7,806 | $204,400 | $78,100 | $126,300 |
| 2014 | $7,510 | $204,400 | $78,100 | $126,300 |
Source: Public Records
Map
Nearby Homes
- 70 Mountain Laurel Dr Unit 70
- 11 Charter Rd
- 31 Ox Yoke Dr
- 89 Merriman Rd
- 38 Wheeler Rd
- 250 Edward St
- 268 Fox Hill Rd
- 750 Wolcott Hill Rd
- 455 Brimfield Rd
- 18 Mcintosh Cir Unit 18
- 137 Dale Rd
- 0 Collier Rd
- 99 Maple St
- 101 Collier Rd
- 158 Dix Rd
- 1610 Silas Deane Hwy
- 155 Old Common Rd
- 131 Coleman Rd
- 108 Chamberlain Rd
- 147 Spring St
Your Personal Tour Guide
Ask me questions while you tour the home.