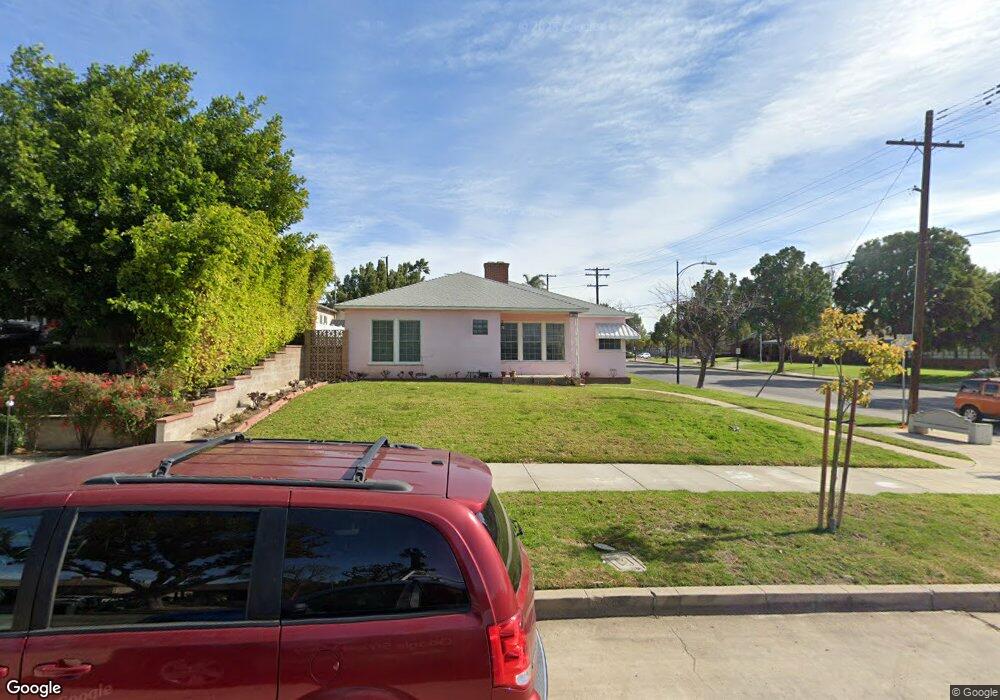
400 Andover Dr Burbank, CA 91504
Hillside District NeighborhoodEstimated Value: $1,297,885 - $1,498,000
2
Beds
2
Baths
1,622
Sq Ft
$858/Sq Ft
Est. Value
About This Home
This home is located at 400 Andover Dr, Burbank, CA 91504 and is currently estimated at $1,392,221, approximately $858 per square foot. 400 Andover Dr is a home located in Los Angeles County with nearby schools including Thomas Jefferson Elementary School, John Muir Middle School, and Burbank High School.
Ownership History
Date
Name
Owned For
Owner Type
Purchase Details
Closed on
May 8, 2002
Sold by
Foy John F and Foy Roderick
Bought by
Foy Dennis J and Foy Susan R
Current Estimated Value
Home Financials for this Owner
Home Financials are based on the most recent Mortgage that was taken out on this home.
Original Mortgage
$200,000
Interest Rate
6.6%
Purchase Details
Closed on
Sep 2, 1999
Sold by
Foy John F
Bought by
John Francis Foy Sr Revocable Trust Of
Create a Home Valuation Report for This Property
The Home Valuation Report is an in-depth analysis detailing your home's value as well as a comparison with similar homes in the area
Home Values in the Area
Average Home Value in this Area
Purchase History
| Date | Buyer | Sale Price | Title Company |
|---|---|---|---|
| Foy Dennis J | $250,000 | Lawyers Title Company | |
| John Francis Foy Sr Revocable Trust Of | -- | -- |
Source: Public Records
Mortgage History
| Date | Status | Borrower | Loan Amount |
|---|---|---|---|
| Closed | Foy Dennis J | $200,000 |
Source: Public Records
Tax History
| Year | Tax Paid | Tax Assessment Tax Assessment Total Assessment is a certain percentage of the fair market value that is determined by local assessors to be the total taxable value of land and additions on the property. | Land | Improvement |
|---|---|---|---|---|
| 2025 | $4,985 | $444,266 | $339,500 | $104,766 |
| 2024 | $4,985 | $435,556 | $332,844 | $102,712 |
| 2023 | $4,933 | $427,017 | $326,318 | $100,699 |
| 2022 | $4,711 | $418,645 | $319,920 | $98,725 |
| 2021 | $4,686 | $410,438 | $313,648 | $96,790 |
| 2020 | $4,634 | $406,230 | $310,432 | $95,798 |
| 2019 | $4,499 | $398,266 | $304,346 | $93,920 |
| 2018 | $4,387 | $390,458 | $298,379 | $92,079 |
| 2016 | $4,154 | $375,298 | $286,794 | $88,504 |
| 2015 | $4,070 | $369,662 | $282,487 | $87,175 |
| 2014 | $4,065 | $362,422 | $276,954 | $85,468 |
Source: Public Records
Map
Nearby Homes
- 430 Tufts Ave
- 505 Cambridge Dr
- 441 Dartmouth Rd
- 1814 Grismer Ave
- 1608 Grismer Ave
- 1515 Grismer Ave Unit 102
- 1515 Grismer Ave Unit 302
- 230 Bethany Rd Unit 124
- 1819 Richard St
- 2031 Jolley Dr
- 1719 Landis St
- 2014 Peyton Ave
- 227 E Burbank Blvd Unit C
- 1924 N Parish Place
- 718 E Walnut Ave
- 1304 N Griffith Park Dr
- 902 E Walnut Ave
- 610 E Harvard Rd Unit 7
- 2316 N Parish Place
- 2615 Woodstock Ln
Your Personal Tour Guide
Ask me questions while you tour the home.