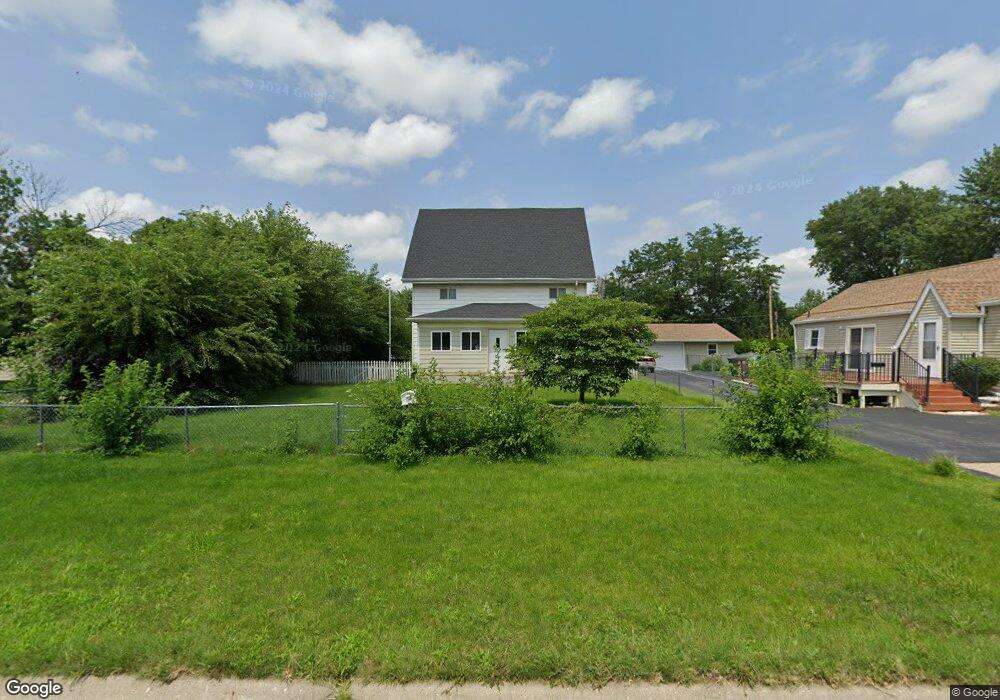
401 3rd St SE Altoona, IA 50009
Estimated Value: $201,676 - $236,000
4
Beds
2
Baths
1,568
Sq Ft
$140/Sq Ft
Est. Value
About This Home
This home is located at 401 3rd St SE, Altoona, IA 50009 and is currently estimated at $218,838, approximately $139 per square foot. 401 3rd St SE is a home located in Polk County with nearby schools including Centennial Elementary School, Southeast Polk Spring Creek- 6th Grade, and Southeast Polk Junior High School.
Ownership History
Date
Name
Owned For
Owner Type
Purchase Details
Closed on
Oct 25, 2019
Sold by
Cory Eric E and Cory Melissa R
Bought by
Cory Tanner T and Cory Taylor M
Current Estimated Value
Home Financials for this Owner
Home Financials are based on the most recent Mortgage that was taken out on this home.
Original Mortgage
$140,885
Outstanding Balance
$123,694
Interest Rate
3.5%
Mortgage Type
New Conventional
Estimated Equity
$95,144
Purchase Details
Closed on
Apr 27, 2011
Sold by
Rons Homes Inc
Bought by
Karns Joyce A
Home Financials for this Owner
Home Financials are based on the most recent Mortgage that was taken out on this home.
Original Mortgage
$168,000
Interest Rate
4.77%
Mortgage Type
Commercial
Create a Home Valuation Report for This Property
The Home Valuation Report is an in-depth analysis detailing your home's value as well as a comparison with similar homes in the area
Home Values in the Area
Average Home Value in this Area
Purchase History
| Date | Buyer | Sale Price | Title Company |
|---|---|---|---|
| Cory Tanner T | $148,500 | None Available | |
| Karns Joyce A | $167,500 | None Available |
Source: Public Records
Mortgage History
| Date | Status | Borrower | Loan Amount |
|---|---|---|---|
| Open | Cory Tanner T | $140,885 | |
| Previous Owner | Karns Joyce A | $168,000 |
Source: Public Records
Tax History Compared to Growth
Tax History
| Year | Tax Paid | Tax Assessment Tax Assessment Total Assessment is a certain percentage of the fair market value that is determined by local assessors to be the total taxable value of land and additions on the property. | Land | Improvement |
|---|---|---|---|---|
| 2024 | $3,248 | $199,000 | $44,900 | $154,100 |
| 2023 | $3,152 | $199,000 | $44,900 | $154,100 |
| 2022 | $3,112 | $163,400 | $38,000 | $125,400 |
| 2021 | $2,958 | $163,400 | $38,000 | $125,400 |
| 2020 | $2,906 | $148,300 | $34,200 | $114,100 |
| 2019 | $2,660 | $148,300 | $34,200 | $114,100 |
| 2018 | $2,660 | $133,900 | $30,100 | $103,800 |
| 2017 | $2,744 | $133,900 | $30,100 | $103,800 |
| 2016 | $2,734 | $125,500 | $27,700 | $97,800 |
| 2015 | $2,734 | $125,500 | $27,700 | $97,800 |
| 2014 | $2,572 | $117,700 | $25,400 | $92,300 |
Source: Public Records
Map
Nearby Homes
- 400 4th St SE
- 505 5th St SE
- 301 5th Street Place SE
- 603 1st Ave S
- 136 8th NE
- 128 8th NE
- 120 8th NE
- 101 8th Ave SE
- 605 1st Ave S
- 109 8th NE
- 109 8th Ave SE
- 136 8th Ave SE
- 128 8th Ave SE
- 120 8th Ave SE
- 506 2nd Ave SW
- Lincoln Plan at Edgewood Trail
- Fairfield Plan at Edgewood Trail
- Madison Plan at Edgewood Trail
- Holland Plan at Edgewood Trail
- Reagan Plan at Edgewood Trail