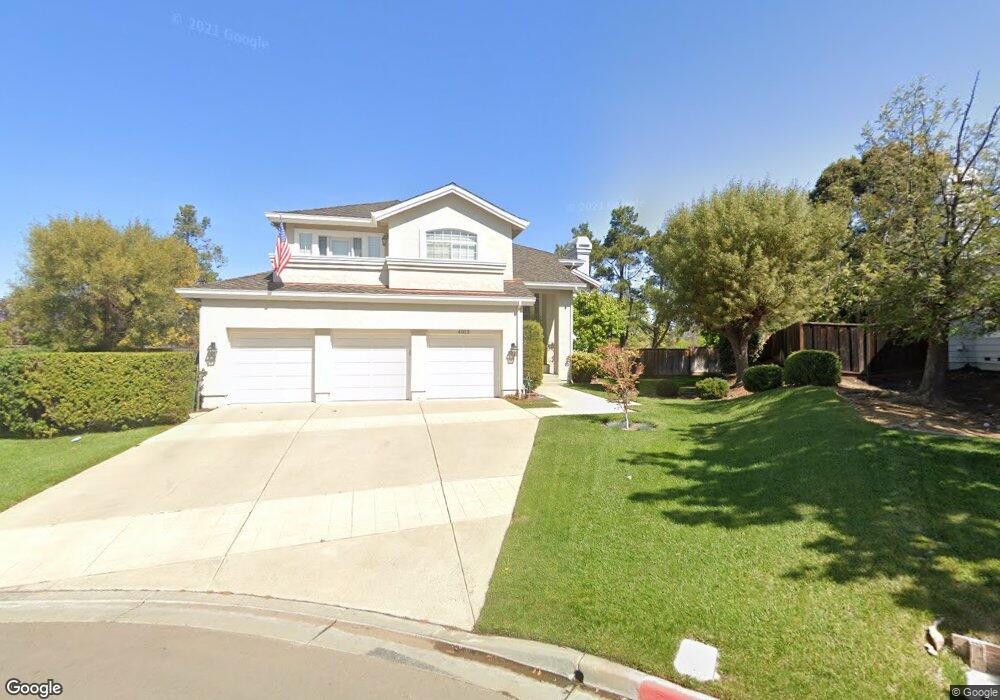
4013 Pons Ct Pleasanton, CA 94566
Estimated Value: $2,122,000 - $2,649,000
5
Beds
4
Baths
3,401
Sq Ft
$695/Sq Ft
Est. Value
About This Home
This home is located at 4013 Pons Ct, Pleasanton, CA 94566 and is currently estimated at $2,364,820, approximately $695 per square foot. 4013 Pons Ct is a home located in Alameda County with nearby schools including Vintage Hills Elementary School, Pleasanton Middle School, and Foothill High School.
Ownership History
Date
Name
Owned For
Owner Type
Purchase Details
Closed on
Feb 26, 2009
Sold by
Huey Douglas Clayton and Huey Mary Ellen
Bought by
Huey Douglas Clayton and Huey Mary Ellen
Current Estimated Value
Home Financials for this Owner
Home Financials are based on the most recent Mortgage that was taken out on this home.
Original Mortgage
$408,000
Outstanding Balance
$257,639
Interest Rate
5%
Mortgage Type
New Conventional
Estimated Equity
$2,107,181
Purchase Details
Closed on
Jul 14, 1999
Sold by
Huey Douglas C and Huey Mary E
Bought by
The Huey Family Revocable Trust
Purchase Details
Closed on
Sep 6, 1994
Sold by
Nemecek James C and Peake Nemecek Judith
Bought by
Huey Douglas Clayton and Huey Mary Ellen
Home Financials for this Owner
Home Financials are based on the most recent Mortgage that was taken out on this home.
Original Mortgage
$480,000
Interest Rate
4.12%
Create a Home Valuation Report for This Property
The Home Valuation Report is an in-depth analysis detailing your home's value as well as a comparison with similar homes in the area
Purchase History
| Date | Buyer | Sale Price | Title Company |
|---|---|---|---|
| Huey Douglas Clayton | -- | Ticor Title Company Of Calif | |
| Huey Douglas Clayton | -- | Ticor Title Company Of Ca | |
| The Huey Family Revocable Trust | -- | -- | |
| Huey Douglas Clayton | $674,500 | North American Title Company |
Source: Public Records
Mortgage History
| Date | Status | Borrower | Loan Amount |
|---|---|---|---|
| Open | Huey Douglas Clayton | $408,000 | |
| Closed | Huey Douglas Clayton | $480,000 |
Source: Public Records
Tax History
| Year | Tax Paid | Tax Assessment Tax Assessment Total Assessment is a certain percentage of the fair market value that is determined by local assessors to be the total taxable value of land and additions on the property. | Land | Improvement |
|---|---|---|---|---|
| 2025 | $13,041 | $1,129,517 | $339,937 | $796,580 |
| 2024 | $13,041 | $1,107,236 | $333,273 | $780,963 |
| 2023 | $12,891 | $1,092,394 | $326,740 | $765,654 |
| 2022 | $12,210 | $1,063,977 | $320,334 | $750,643 |
| 2021 | $11,897 | $1,042,981 | $314,054 | $735,927 |
| 2020 | $11,744 | $1,039,215 | $310,834 | $728,381 |
| 2019 | $11,886 | $1,018,841 | $304,740 | $714,101 |
| 2018 | $11,645 | $998,866 | $298,765 | $700,101 |
| 2017 | $11,346 | $979,283 | $292,908 | $686,375 |
| 2016 | $10,476 | $960,086 | $287,166 | $672,920 |
| 2015 | $10,279 | $945,667 | $282,853 | $662,814 |
| 2014 | $10,463 | $927,147 | $277,314 | $649,833 |
Source: Public Records
Map
Nearby Homes
- 4262 Tamur Ct
- 601 Palomino Dr Unit D
- 691 Concord Place
- 389 Mavis Dr
- 3375 Norton Way Unit 5
- 3436 Smoketree Commons
- 351 Christina Ct
- 327 Linden Way
- 3845 Vineyard Ave Unit F
- 215 Mavis Dr
- 3841 Vineyard Ave Unit 18
- 3839 Vineyard Ave Unit 45
- 3877 Vine St
- 3231 Vineyard Ave Unit 141
- 3231 Vineyard Ave Unit 33
- 3231 Vineyard Ave Unit 93
- 3231 Vineyard Ave Unit 21
- 3263 Vineyard Ave Unit 113
- 3263 Vineyard Ave Unit 44
- 3263 Vineyard Ave Unit 68
- 4019 Pons Ct
- 4007 Pons Ct
- 1139 Kottinger Dr Unit B
- 1139 Kottinger Dr Unit A
- 1133 Kottinger Dr Unit 1
- 1133 Kottinger Dr Unit 4
- 1133 Kottinger Dr
- 1133 Kottinger Dr
- 1133 Kottinger Dr
- 1133 Kottinger Dr
- 1127 Kottinger Dr
- 1127 Kottinger Dr
- 1127 Kottinger Dr
- 1127 Kottinger Dr
- 4001 Pons Ct
- 1137 Kottinger Dr Unit A
- 1137 Kottinger Dr Unit C
- 1137 Kottinger Dr Unit B
- 1137 Kottinger Dr Unit CA3
- 1137 Kottinger Dr Unit BA2
Your Personal Tour Guide
Ask me questions while you tour the home.