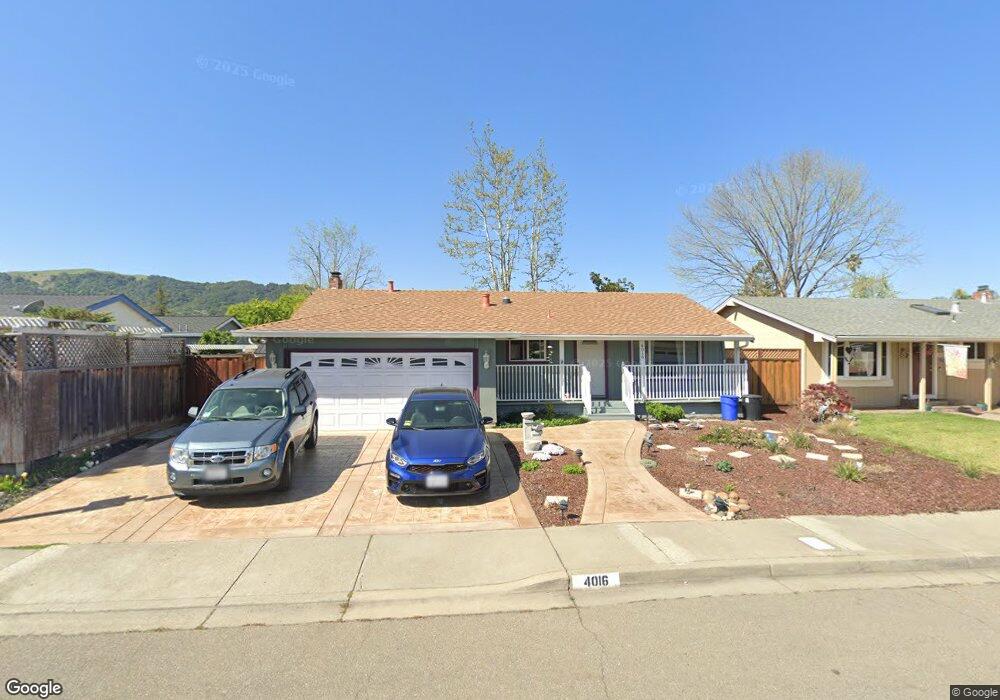
4016 Crest Ct Pleasanton, CA 94588
Stoneridge NeighborhoodEstimated Value: $1,233,891 - $1,354,000
3
Beds
2
Baths
1,372
Sq Ft
$963/Sq Ft
Est. Value
About This Home
This home is located at 4016 Crest Ct, Pleasanton, CA 94588 and is currently estimated at $1,320,973, approximately $962 per square foot. 4016 Crest Ct is a home located in Alameda County with nearby schools including Donlon Elementary School, Thomas S. Hart Middle School, and Foothill High School.
Ownership History
Date
Name
Owned For
Owner Type
Purchase Details
Closed on
Oct 15, 2021
Sold by
Seaborn Scott C and Seaborn Marni K
Bought by
Seaborn Scott Curtis and Seaborn Marni Karen
Current Estimated Value
Purchase Details
Closed on
Aug 10, 2010
Sold by
Kowshik Raghu and Kowshik Kamala
Bought by
Seaborn Scott C and Seaborn Marni K
Home Financials for this Owner
Home Financials are based on the most recent Mortgage that was taken out on this home.
Original Mortgage
$417,000
Outstanding Balance
$275,258
Interest Rate
4.51%
Mortgage Type
New Conventional
Estimated Equity
$1,045,715
Purchase Details
Closed on
Jun 9, 2000
Sold by
Yee Randall J
Bought by
Kowshik Raghu and Kowshik Kamala
Home Financials for this Owner
Home Financials are based on the most recent Mortgage that was taken out on this home.
Original Mortgage
$296,750
Interest Rate
8.27%
Purchase Details
Closed on
Oct 22, 1997
Sold by
Ennor John A and Kolesar Maria F
Bought by
Yee Randall J
Home Financials for this Owner
Home Financials are based on the most recent Mortgage that was taken out on this home.
Original Mortgage
$210,000
Interest Rate
6.62%
Create a Home Valuation Report for This Property
The Home Valuation Report is an in-depth analysis detailing your home's value as well as a comparison with similar homes in the area
Home Values in the Area
Average Home Value in this Area
Purchase History
| Date | Buyer | Sale Price | Title Company |
|---|---|---|---|
| Seaborn Scott Curtis | -- | None Available | |
| Seaborn Scott C | $555,000 | Fidelity National Title Co | |
| Kowshik Raghu | $371,000 | First California Title Compa | |
| Yee Randall J | $242,000 | Old Republic Title Company |
Source: Public Records
Mortgage History
| Date | Status | Borrower | Loan Amount |
|---|---|---|---|
| Open | Seaborn Scott C | $417,000 | |
| Previous Owner | Kowshik Raghu | $296,750 | |
| Previous Owner | Yee Randall J | $210,000 | |
| Closed | Kowshik Raghu | $74,200 |
Source: Public Records
Tax History
| Year | Tax Paid | Tax Assessment Tax Assessment Total Assessment is a certain percentage of the fair market value that is determined by local assessors to be the total taxable value of land and additions on the property. | Land | Improvement |
|---|---|---|---|---|
| 2025 | $8,164 | $704,010 | $213,303 | $497,707 |
| 2024 | $8,164 | $690,074 | $209,122 | $487,952 |
| 2023 | $8,069 | $683,410 | $205,023 | $478,387 |
| 2022 | $7,643 | $663,011 | $201,003 | $469,008 |
| 2021 | $7,446 | $649,875 | $197,062 | $459,813 |
| 2020 | $7,351 | $650,143 | $195,043 | $455,100 |
| 2019 | $7,438 | $637,400 | $191,220 | $446,180 |
| 2018 | $7,287 | $624,907 | $187,472 | $437,435 |
| 2017 | $7,100 | $612,658 | $183,797 | $428,861 |
| 2016 | $6,553 | $600,648 | $180,194 | $420,454 |
| 2015 | $6,430 | $591,630 | $177,489 | $414,141 |
| 2014 | $6,543 | $580,041 | $174,012 | $406,029 |
Source: Public Records
Map
Nearby Homes
- 6762 Rancho Ct
- 3920 Empire Ct
- 4234 Chapman Way
- 6172 Everglades Ct
- 7333 Tulipwood Cir
- 4645 Helpert Ct
- 7544 Highland Oaks Dr
- 7210 Valley View Ct
- 3641 Shenandoah Ct
- 0 Highway 128 Hwy Unit 326001688
- 3636 Shenandoah Ct
- 7332 Stonedale Dr
- 7358 Elmwood Cir
- 7543 Maywood Dr
- 7758 Forsythia Ct
- 7551 Maywood Dr
- 5262 Riverdale Ct
- 3460 Serra Cir
- 7518 Rosedale Ct
- 2642 Corte Vida
- 4024 Crest Ct
- 6503 Singletree Way
- 6519 Singletree Way
- 4123 Payne Rd
- 4141 Payne Rd
- 4032 Crest Ct
- 6535 Singletree Way
- 4019 Crest Ct
- 4159 Payne Rd
- 4027 Crest Ct
- 4011 Crest Ct
- 4040 Crest Ct
- 4035 Crest Ct
- 4177 Payne Rd
- 6506 Singletree Way
- 4043 Crest Ct
- 3985 Alma Ct
- 4095 Payne Rd
- 4014 Jackie Ct
- 4048 Crest Ct
Your Personal Tour Guide
Ask me questions while you tour the home.