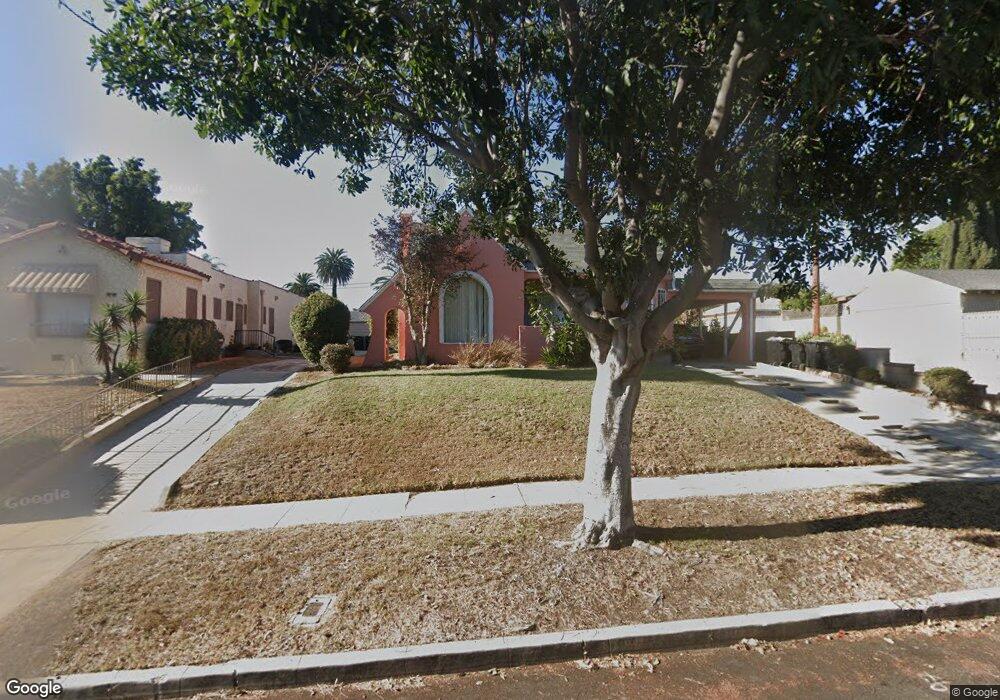
4017 W 64th St Los Angeles, CA 90043
Hyde Park NeighborhoodEstimated Value: $957,452 - $1,111,000
3
Beds
2
Baths
1,606
Sq Ft
$649/Sq Ft
Est. Value
About This Home
This home is located at 4017 W 64th St, Los Angeles, CA 90043 and is currently estimated at $1,041,613, approximately $648 per square foot. 4017 W 64th St is a home located in Los Angeles County with nearby schools including Fifty-Fourth Street Elementary School, Audubon Middle School, and Crenshaw Science, Technology, Engineering, Math And Medicine Magnet.
Ownership History
Date
Name
Owned For
Owner Type
Purchase Details
Closed on
Sep 17, 2024
Sold by
Dickens Lonzo
Bought by
Lonzo Dickens Revocable Living Trust and Dickens
Current Estimated Value
Purchase Details
Closed on
Oct 5, 1994
Sold by
Great & Global Investment Co
Bought by
Dickens Lonzo
Home Financials for this Owner
Home Financials are based on the most recent Mortgage that was taken out on this home.
Original Mortgage
$126,900
Interest Rate
8.54%
Purchase Details
Closed on
Sep 27, 1994
Sold by
Ogami Tsuneo
Bought by
Great & Global Investment Co
Home Financials for this Owner
Home Financials are based on the most recent Mortgage that was taken out on this home.
Original Mortgage
$126,900
Interest Rate
8.54%
Purchase Details
Closed on
Apr 7, 1994
Sold by
Anchor Mtg Service Inc
Bought by
Ogami Tsuneo
Create a Home Valuation Report for This Property
The Home Valuation Report is an in-depth analysis detailing your home's value as well as a comparison with similar homes in the area
Home Values in the Area
Average Home Value in this Area
Purchase History
| Date | Buyer | Sale Price | Title Company |
|---|---|---|---|
| Lonzo Dickens Revocable Living Trust | -- | None Listed On Document | |
| Dickens Lonzo | $141,000 | Provident Title | |
| Great & Global Investment Co | -- | Provident Title | |
| Ogami Tsuneo | -- | Provident Title | |
| Ogami Tsuneo | $98,500 | -- |
Source: Public Records
Mortgage History
| Date | Status | Borrower | Loan Amount |
|---|---|---|---|
| Previous Owner | Dickens Lonzo | $126,900 |
Source: Public Records
Tax History Compared to Growth
Tax History
| Year | Tax Paid | Tax Assessment Tax Assessment Total Assessment is a certain percentage of the fair market value that is determined by local assessors to be the total taxable value of land and additions on the property. | Land | Improvement |
|---|---|---|---|---|
| 2025 | $3,781 | $289,580 | $94,045 | $195,535 |
| 2024 | $3,781 | $283,902 | $92,201 | $191,701 |
| 2023 | $3,713 | $278,337 | $90,394 | $187,943 |
| 2022 | $3,553 | $272,880 | $88,622 | $184,258 |
| 2021 | $3,496 | $267,531 | $86,885 | $180,646 |
| 2019 | $3,395 | $259,598 | $84,309 | $175,289 |
| 2018 | $3,302 | $254,508 | $82,656 | $171,852 |
| 2016 | $3,142 | $244,628 | $79,448 | $165,180 |
| 2015 | $3,094 | $240,954 | $78,255 | $162,699 |
| 2014 | $3,107 | $236,235 | $76,723 | $159,512 |
Source: Public Records
Map
Nearby Homes
- 3961 W 64th St
- 3932 W 64th St
- 935 E Fairview Blvd
- 612 E Fairview Blvd
- 4210 W 62nd St
- 610 E Fairview Blvd
- 914 Alpha St
- 1005 E Brett St
- 6330 S Harcourt Ave
- 1256 Welton Way
- 1109 N Chester Ave
- 6018 S Harcourt Ave
- 3831 W 60th St
- 3815 W 60th St
- 925 E 65th St
- 6325 Long St
- 3854 W 59th St
- 1045 E Hyde Park Blvd
- 916 E 65th St Unit 3
- 924 N Chester Ave
- 4023 W 64th St
- 6319 Alviso Ave
- 6325 Alviso Ave
- 6315 Alviso Ave
- 4016 W 63rd St
- 6311 Alviso Ave
- 4022 W 63rd St
- 6330 S Verdun Ave
- 6309 Alviso Ave
- 6322 S Verdun Ave
- 4026 W 63rd St
- 4012 W 64th St
- 6316 S Verdun Ave
- 4016 W 64th St
- 4008 W 64th St
- 4020 W 64th St
- 4000 W 63rd St
- 4004 W 64th St
- 4034 W 63rd St
- 4024 W 64th St