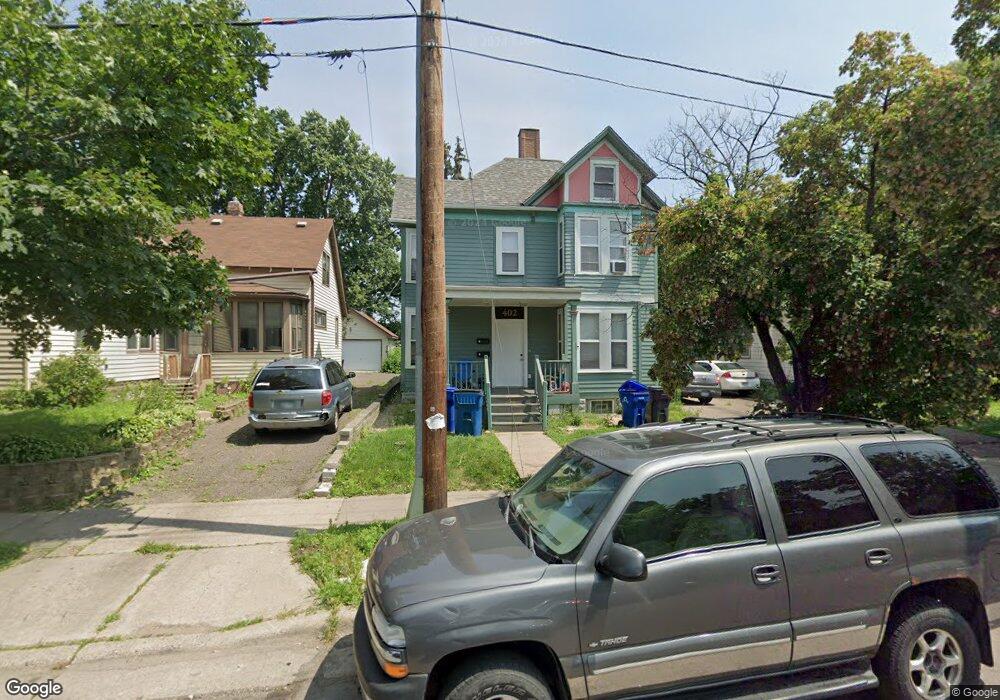
402 Hope St Saint Paul, MN 55106
Dayton's Bluff NeighborhoodEstimated Value: $333,000 - $460,000
6
Beds
4
Baths
2,217
Sq Ft
$185/Sq Ft
Est. Value
About This Home
This home is located at 402 Hope St, Saint Paul, MN 55106 and is currently estimated at $409,415, approximately $184 per square foot. 402 Hope St is a home located in Ramsey County with nearby schools including Dayton's Bluff Achievement Plus Elementary School, Battle Creek Middle School, and Harding Senior High School.
Ownership History
Date
Name
Owned For
Owner Type
Purchase Details
Closed on
Feb 20, 2015
Bought by
Eckman Shannon Shannon
Current Estimated Value
Purchase Details
Closed on
Feb 17, 2015
Sold by
Housing & Redevelopment Authority Of The
Bought by
Eckman Shannon K
Purchase Details
Closed on
Apr 28, 2000
Sold by
Baluyut Jennifer
Bought by
Brecher Scott and Brecher Laurel
Purchase Details
Closed on
Jun 5, 1997
Sold by
Favis Gloria Cirila
Bought by
Balyut Jennifer
Create a Home Valuation Report for This Property
The Home Valuation Report is an in-depth analysis detailing your home's value as well as a comparison with similar homes in the area
Home Values in the Area
Average Home Value in this Area
Purchase History
| Date | Buyer | Sale Price | Title Company |
|---|---|---|---|
| Eckman Shannon Shannon | $12,700 | -- | |
| Eckman Shannon K | $12,729 | None Available | |
| Brecher Scott | $170,000 | -- | |
| Balyut Jennifer | $1,000 | -- | |
| Favis Gloria Cirila | $68,000 | -- |
Source: Public Records
Tax History Compared to Growth
Tax History
| Year | Tax Paid | Tax Assessment Tax Assessment Total Assessment is a certain percentage of the fair market value that is determined by local assessors to be the total taxable value of land and additions on the property. | Land | Improvement |
|---|---|---|---|---|
| 2025 | $8,266 | $407,900 | $23,800 | $384,100 |
| 2023 | $8,266 | $348,100 | $12,400 | $335,700 |
| 2022 | $4,058 | $329,300 | $12,400 | $316,900 |
| 2021 | $3,692 | $307,300 | $12,400 | $294,900 |
| 2020 | $3,504 | $292,000 | $12,400 | $279,600 |
| 2019 | $3,350 | $256,400 | $12,400 | $244,000 |
| 2018 | $2,920 | $241,500 | $12,400 | $229,100 |
| 2017 | $3,466 | $223,300 | $12,400 | $210,900 |
| 2016 | $3,330 | $0 | $0 | $0 |
| 2015 | -- | $195,700 | $10,500 | $185,200 |
| 2014 | $105 | $0 | $0 | $0 |
Source: Public Records
Map
Nearby Homes