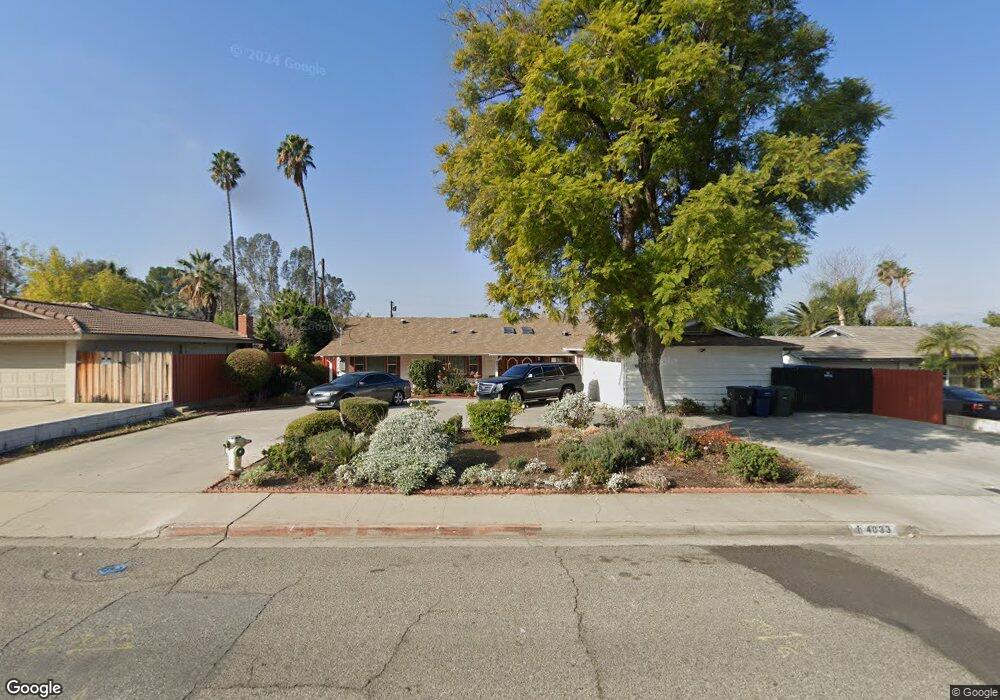
4033 Mt Vernon Guesthouse Ave Riverside, CA 92507
University NeighborhoodEstimated Value: $837,000 - $978,000
2
Beds
2
Baths
1,500
Sq Ft
$588/Sq Ft
Est. Value
About This Home
This home is located at 4033 Mt Vernon Guesthouse Ave, Riverside, CA 92507 and is currently estimated at $882,331, approximately $588 per square foot. 4033 Mt Vernon Guesthouse Ave is a home located in Riverside County with nearby schools including Highland Elementary, University Heights Middle School, and John W. North High School.
Ownership History
Date
Name
Owned For
Owner Type
Purchase Details
Closed on
Sep 18, 2020
Sold by
Marvin Brian D and Marvin Brian D
Bought by
Marvin Brian D and The Brian Marvin Family Trust
Current Estimated Value
Purchase Details
Closed on
Jul 3, 2020
Sold by
Marvin Brian D and Marvin Brian D
Bought by
Marvin Brian D
Home Financials for this Owner
Home Financials are based on the most recent Mortgage that was taken out on this home.
Original Mortgage
$442,500
Outstanding Balance
$392,380
Interest Rate
3.1%
Mortgage Type
New Conventional
Estimated Equity
$489,951
Purchase Details
Closed on
Jan 17, 2019
Sold by
Gomez Natalie
Bought by
Marvin Brian D
Home Financials for this Owner
Home Financials are based on the most recent Mortgage that was taken out on this home.
Original Mortgage
$437,600
Interest Rate
4.5%
Mortgage Type
New Conventional
Purchase Details
Closed on
Nov 25, 1996
Sold by
Albert Lumpe and Lumpe Kathleen S
Bought by
Lumpe Albert and Lumpe Kathleen S
Create a Home Valuation Report for This Property
The Home Valuation Report is an in-depth analysis detailing your home's value as well as a comparison with similar homes in the area
Home Values in the Area
Average Home Value in this Area
Purchase History
| Date | Buyer | Sale Price | Title Company |
|---|---|---|---|
| Marvin Brian D | -- | None Available | |
| Marvin Brian D | -- | First American Title Company | |
| Marvin Brian D | $547,000 | Chicago Title Inland Empire | |
| Lumpe Albert | -- | -- |
Source: Public Records
Mortgage History
| Date | Status | Borrower | Loan Amount |
|---|---|---|---|
| Open | Marvin Brian D | $442,500 | |
| Closed | Marvin Brian D | $437,600 |
Source: Public Records
Tax History Compared to Growth
Tax History
| Year | Tax Paid | Tax Assessment Tax Assessment Total Assessment is a certain percentage of the fair market value that is determined by local assessors to be the total taxable value of land and additions on the property. | Land | Improvement |
|---|---|---|---|---|
| 2025 | $6,613 | $610,184 | $100,395 | $509,789 |
| 2023 | $6,613 | $586,493 | $96,498 | $489,995 |
| 2022 | $6,463 | $574,994 | $94,606 | $480,388 |
| 2021 | $6,372 | $563,720 | $92,751 | $470,969 |
| 2020 | $6,324 | $557,940 | $91,800 | $466,140 |
| 2019 | $5,679 | $500,000 | $90,000 | $410,000 |
| 2018 | $1,299 | $115,602 | $17,168 | $98,434 |
| 2017 | $1,275 | $113,336 | $16,832 | $96,504 |
| 2016 | $1,196 | $111,114 | $16,502 | $94,612 |
| 2015 | $1,177 | $109,447 | $16,255 | $93,192 |
| 2014 | $1,164 | $107,305 | $15,938 | $91,367 |
Source: Public Records
Map
Nearby Homes
- 151 Barret Rd
- 4530 Watkins Dr
- 3540 Watkins Dr
- 3378 Mount Vernon Ave
- 3386 Somis Dr
- 138 Green Oaks Dr
- 230 E Blaine St
- 270 W Blaine St
- 3160 Terrace Dr
- 20682 Hill Top Dr
- 2935 Galaxie Heights Rd
- 350 Glenhill Dr
- 5148 Humboldt Ct
- 837 Apache Trail
- 566 Bruin Dr
- 840 Apache Trail
- 0 Pettegrew Rd Unit IV24204869
- 375 Central Ave Unit 83
- 5005 Pearblossom Dr
- 0 Westpoint Dr
- 4033 Mount Vernon Ave
- 4055 Mt Vernon Ave
- 4055 Mount Vernon Ave
- 4011 Mount Vernon Ave
- 4075 Mt Vernon Ave
- 4075 Mount Vernon Ave
- 147 W Broadbent Dr
- 151 W Broadbent Dr
- 4026 Mount Vernon Ave
- 3989 Mount Vernon Ave
- 145 W Broadbent Dr
- 4044 Mount Vernon Ave
- 4008 Mount Vernon Ave
- 4066 Mount Vernon Ave
- 155 W Broadbent Dr
- 4101 Mount Vernon Ave
- 3986 Mount Vernon Ave
- 139 W Broadbent Dr
- 4086 Mount Vernon Ave
- 108 Barret Rd