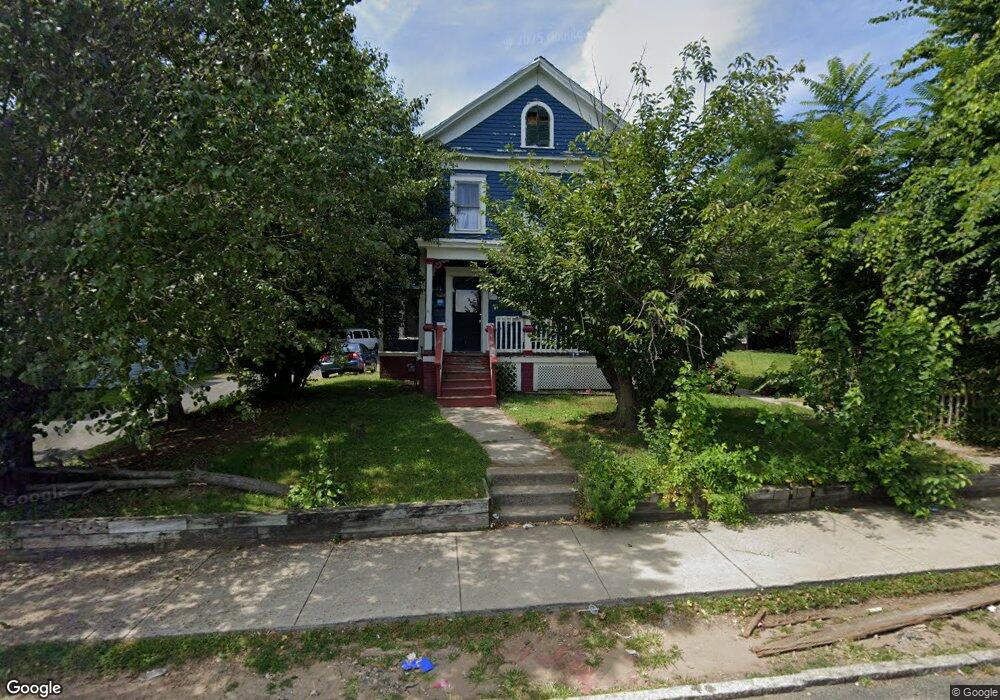
404 Hancock St Springfield, MA 01105
Maple-High Six Corners NeighborhoodEstimated Value: $238,000 - $295,000
4
Beds
2
Baths
1,969
Sq Ft
$137/Sq Ft
Est. Value
About This Home
This home is located at 404 Hancock St, Springfield, MA 01105 and is currently estimated at $269,253, approximately $136 per square foot. 404 Hancock St is a home located in Hampden County with nearby schools including Elias Brookings School, M Marcus Kiley Middle, and High School Of Commerce.
Ownership History
Date
Name
Owned For
Owner Type
Purchase Details
Closed on
Jun 18, 2019
Sold by
Barry Donald P and Barry Kaiser T
Bought by
Kaiser T T and Kaiser Barry
Current Estimated Value
Purchase Details
Closed on
May 12, 2017
Sold by
Spfd Llc
Bought by
400 Hancock Llc
Purchase Details
Closed on
Sep 14, 2016
Sold by
Belmore Apartments Llc and Spfd Llc
Bought by
Spfd Llc
Purchase Details
Closed on
Aug 30, 2011
Sold by
Langevin John T
Bought by
Belmore Apartments Llc
Create a Home Valuation Report for This Property
The Home Valuation Report is an in-depth analysis detailing your home's value as well as a comparison with similar homes in the area
Home Values in the Area
Average Home Value in this Area
Purchase History
| Date | Buyer | Sale Price | Title Company |
|---|---|---|---|
| Kaiser T T | $94,000 | -- | |
| 400 Hancock Llc | $105,000 | -- | |
| Spfd Llc | $75,000 | -- | |
| Belmore Apartments Llc | $14,000 | -- |
Source: Public Records
Tax History
| Year | Tax Paid | Tax Assessment Tax Assessment Total Assessment is a certain percentage of the fair market value that is determined by local assessors to be the total taxable value of land and additions on the property. | Land | Improvement |
|---|---|---|---|---|
| 2025 | $3,272 | $208,700 | $26,000 | $182,700 |
| 2024 | $3,305 | $205,800 | $24,300 | $181,500 |
| 2023 | $3,124 | $183,200 | $23,100 | $160,100 |
| 2022 | $2,693 | $143,100 | $21,000 | $122,100 |
| 2021 | $3,026 | $160,100 | $19,100 | $141,000 |
| 2020 | $2,924 | $149,700 | $19,100 | $130,600 |
| 2019 | $2,525 | $128,300 | $19,100 | $109,200 |
| 2018 | $2,121 | $119,800 | $19,100 | $100,700 |
| 2017 | $2,121 | $107,900 | $15,300 | $92,600 |
| 2016 | $2,155 | $109,600 | $15,300 | $94,300 |
| 2015 | $2,209 | $112,300 | $15,300 | $97,000 |
Source: Public Records
Map
Nearby Homes
Your Personal Tour Guide
Ask me questions while you tour the home.