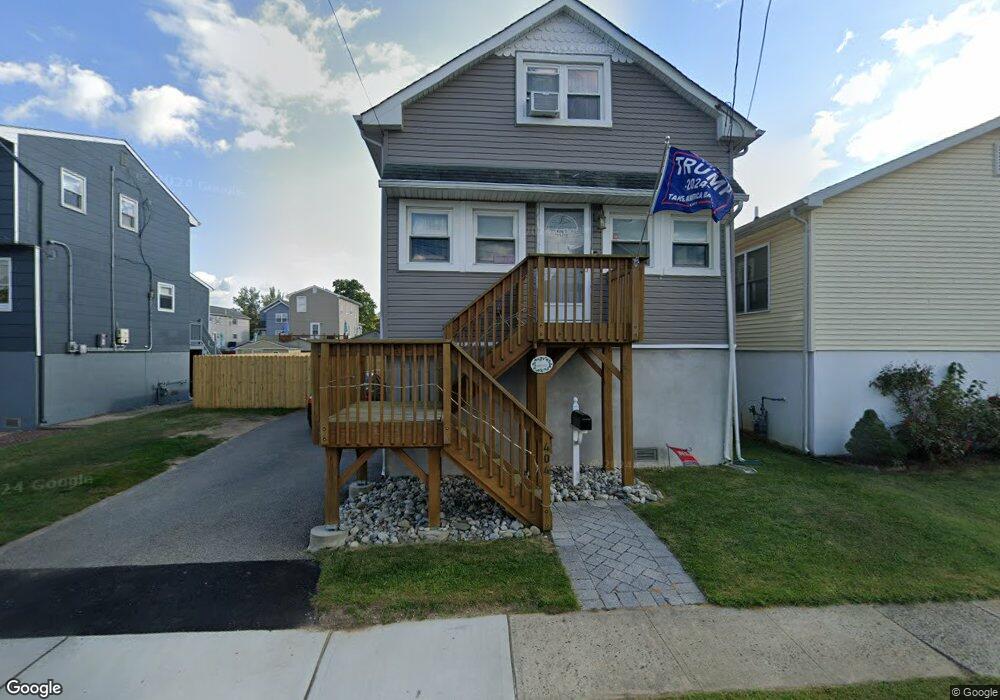
404 Park Ave Union Beach, NJ 07735
Estimated Value: $437,766 - $507,000
3
Beds
2
Baths
1,336
Sq Ft
$351/Sq Ft
Est. Value
About This Home
This home is located at 404 Park Ave, Union Beach, NJ 07735 and is currently estimated at $468,692, approximately $350 per square foot. 404 Park Ave is a home located in Monmouth County with nearby schools including Memorial School and Baytul-Iman Academy.
Ownership History
Date
Name
Owned For
Owner Type
Purchase Details
Closed on
Aug 27, 2002
Sold by
Torres Diego
Bought by
Watson Richard
Current Estimated Value
Home Financials for this Owner
Home Financials are based on the most recent Mortgage that was taken out on this home.
Original Mortgage
$143,900
Outstanding Balance
$61,470
Interest Rate
6.55%
Estimated Equity
$407,222
Purchase Details
Closed on
Aug 15, 1997
Sold by
Middaugh Robert
Bought by
Torres Diego and Torres Patricia
Home Financials for this Owner
Home Financials are based on the most recent Mortgage that was taken out on this home.
Original Mortgage
$85,000
Interest Rate
7.42%
Create a Home Valuation Report for This Property
The Home Valuation Report is an in-depth analysis detailing your home's value as well as a comparison with similar homes in the area
Home Values in the Area
Average Home Value in this Area
Purchase History
| Date | Buyer | Sale Price | Title Company |
|---|---|---|---|
| Watson Richard | $197,900 | -- | |
| Torres Diego | $110,000 | -- |
Source: Public Records
Mortgage History
| Date | Status | Borrower | Loan Amount |
|---|---|---|---|
| Open | Watson Richard | $143,900 | |
| Previous Owner | Torres Diego | $85,000 |
Source: Public Records
Tax History
| Year | Tax Paid | Tax Assessment Tax Assessment Total Assessment is a certain percentage of the fair market value that is determined by local assessors to be the total taxable value of land and additions on the property. | Land | Improvement |
|---|---|---|---|---|
| 2025 | $7,182 | $390,800 | $178,200 | $212,600 |
| 2024 | $6,456 | $348,300 | $146,100 | $202,200 |
Source: Public Records
Map
Nearby Homes
Your Personal Tour Guide
Ask me questions while you tour the home.