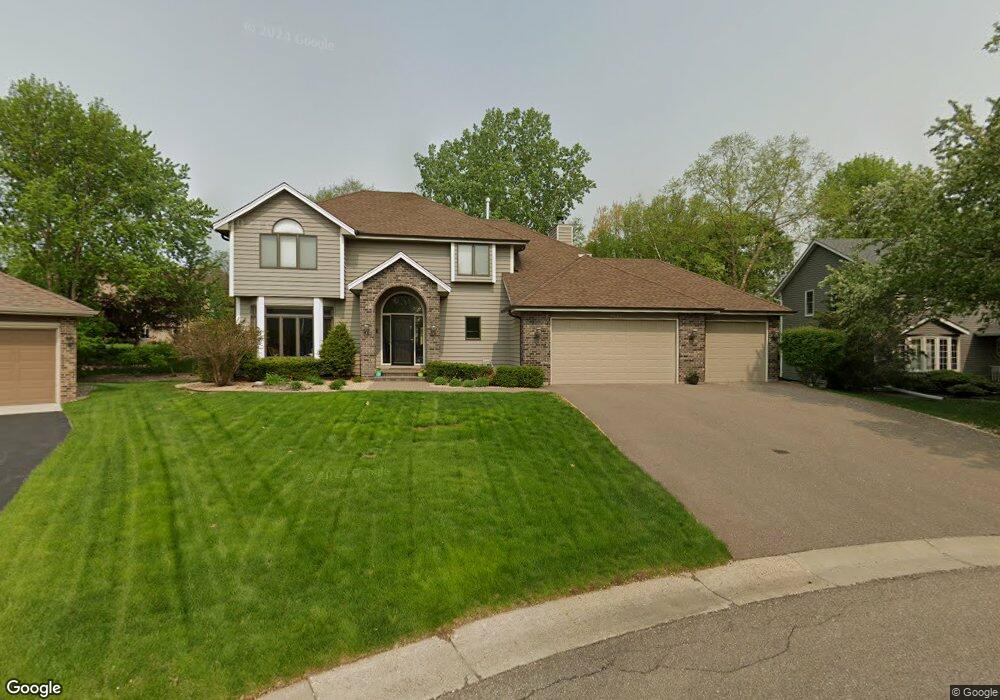
4047 Deerwood Place Saint Paul, MN 55122
Estimated Value: $610,273 - $665,000
4
Beds
4
Baths
2,352
Sq Ft
$273/Sq Ft
Est. Value
About This Home
This home is located at 4047 Deerwood Place, Saint Paul, MN 55122 and is currently estimated at $642,318, approximately $273 per square foot. 4047 Deerwood Place is a home located in Dakota County with nearby schools including Deerwood Elementary School, Black Hawk Middle School, and Eagan Senior High School.
Ownership History
Date
Name
Owned For
Owner Type
Purchase Details
Closed on
May 24, 2018
Sold by
Drasin Ellen J
Bought by
Ross David and Ross Laura
Current Estimated Value
Home Financials for this Owner
Home Financials are based on the most recent Mortgage that was taken out on this home.
Original Mortgage
$300,000
Outstanding Balance
$258,903
Interest Rate
4.5%
Mortgage Type
New Conventional
Estimated Equity
$383,415
Purchase Details
Closed on
Nov 30, 2005
Sold by
Gehl Patricia L and Scrudato Vincent P
Bought by
Drasin Ellen J and Drasin John J
Purchase Details
Closed on
Nov 5, 2004
Sold by
Altermatt John E and Altermatt Margaret
Bought by
Scrudato Vincent P and Gehl Patricia L
Purchase Details
Closed on
May 31, 2000
Sold by
Feda Martha M
Bought by
Altermatt John E and Altermatt Margaret M
Create a Home Valuation Report for This Property
The Home Valuation Report is an in-depth analysis detailing your home's value as well as a comparison with similar homes in the area
Home Values in the Area
Average Home Value in this Area
Purchase History
| Date | Buyer | Sale Price | Title Company |
|---|---|---|---|
| Ross David | $428,500 | None Available | |
| Drasin Ellen J | $465,000 | -- | |
| Scrudato Vincent P | $435,000 | -- | |
| Altermatt John E | $295,000 | -- |
Source: Public Records
Mortgage History
| Date | Status | Borrower | Loan Amount |
|---|---|---|---|
| Open | Ross David | $300,000 |
Source: Public Records
Tax History Compared to Growth
Tax History
| Year | Tax Paid | Tax Assessment Tax Assessment Total Assessment is a certain percentage of the fair market value that is determined by local assessors to be the total taxable value of land and additions on the property. | Land | Improvement |
|---|---|---|---|---|
| 2024 | $6,172 | $567,500 | $134,400 | $433,100 |
| 2023 | $6,172 | $557,800 | $134,800 | $423,000 |
| 2022 | $5,194 | $527,900 | $135,400 | $392,500 |
| 2021 | $4,986 | $461,900 | $117,700 | $344,200 |
| 2020 | $5,004 | $432,600 | $112,100 | $320,500 |
| 2019 | $4,607 | $422,600 | $106,800 | $315,800 |
| 2018 | $4,497 | $409,900 | $101,700 | $308,200 |
| 2017 | $4,566 | $388,500 | $96,900 | $291,600 |
| 2016 | $4,548 | $376,700 | $92,200 | $284,500 |
| 2015 | $4,348 | $368,567 | $91,276 | $277,291 |
| 2014 | -- | $358,212 | $88,664 | $269,548 |
| 2013 | -- | $338,265 | $79,927 | $258,338 |
Source: Public Records
Map
Nearby Homes
- 4049 Deerwood Trail
- 1410 Appaloosa Trail
- 1381 Berry Ridge Rd Unit 503
- 1536 Stonewood Ln
- 4199 Knob Cir Unit 102
- 1443 Cutters Ln
- 3960 Versailles Ct
- 1310 Deerwood Dr
- 1573 Johnny Cake Alcove
- 1497 Kings Wood Rd
- 4168 Arbor Ln
- 4187 Hilltop Point
- 4115 Oakbrooke Curve
- 4249 Boulder Ridge Point
- 1630 Murphy Pkwy
- 3989 Denmark Ave
- 1290 Deerwood Dr
- 4281 Svensk Ln N
- 1680 Oakbrooke Ct
- 3933 Donegal Way
- 4055 Deerwood Place
- 4039 Deerwood Place
- 4026 Deerwood Trail
- 4030 Deerwood Trail
- 4034 Deerwood Trail
- 4042 Deerwood Trail
- 4022 Deerwood Trail
- 4052 Deerwood Place
- 4046 Deerwood Trail
- 4018 Deerwood Trail
- 4054 Deerwood Trail
- 4040 Deerwood Place
- 4048 Deerwood Place
- 4058 Deerwood Trail
- 4044 Deerwood Place
- 4036 Deerwood Place
- 4066 Deerwood Trail
- 4032 Deerwood Place
- 4070 Deerwood Trail
- 4010 Deerwood Trail