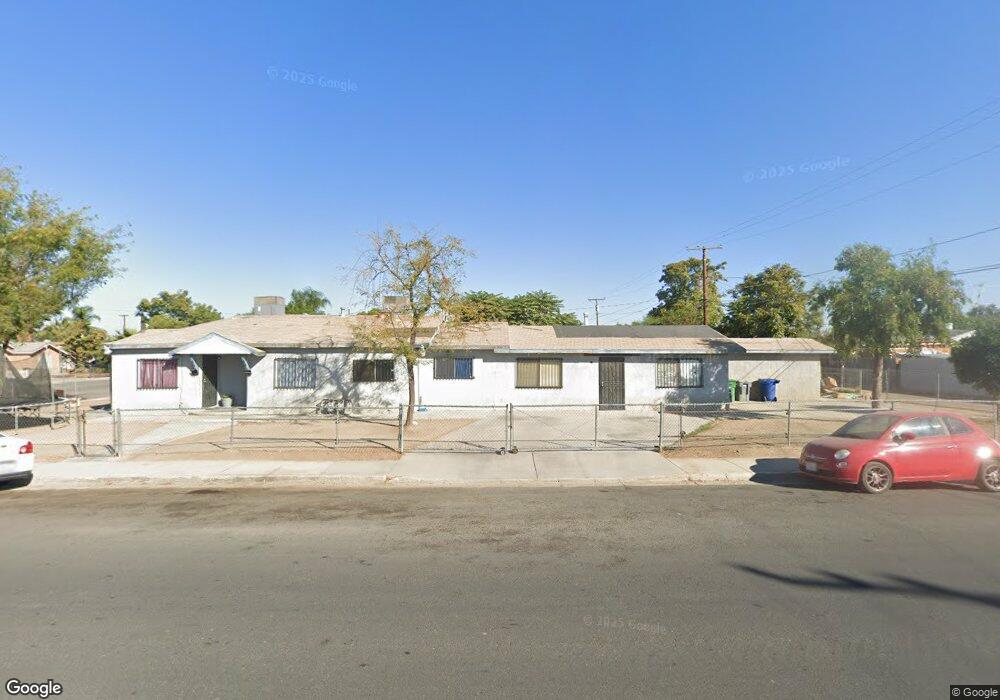
405 6th Ave Delano, CA 93215
West Delano NeighborhoodEstimated Value: $161,000 - $327,000
2
Beds
1
Bath
1,549
Sq Ft
$171/Sq Ft
Est. Value
About This Home
This home is located at 405 6th Ave, Delano, CA 93215 and is currently estimated at $265,333, approximately $171 per square foot. 405 6th Ave is a home located in Kern County with nearby schools including Almond Tree Middle School, Cesar E. Chavez High School, and Nueva Vista Language Academy.
Ownership History
Date
Name
Owned For
Owner Type
Purchase Details
Closed on
Oct 1, 2012
Sold by
Rodriguez Marcos and Rodriguez Lupe L
Bought by
Rodriguez Marcos and Rodriguez Lupe L
Current Estimated Value
Purchase Details
Closed on
Nov 6, 1996
Sold by
Rodriguez Elizabeth Dianne
Bought by
Rodriguez Marcos and Rodriguez Lupe L
Purchase Details
Closed on
Apr 5, 1995
Sold by
Rodriguez Marcos and Rodriguez Lupe L
Bought by
Rodriguez Elizabeth Dianne
Purchase Details
Closed on
Feb 27, 1994
Sold by
Rodriguez Helen M
Bought by
Rodriguez Marcos and Rodriguez Lupe L
Purchase Details
Closed on
Jan 28, 1994
Sold by
Rodriguez Adrian C
Bought by
Rodriguez Marcos and Rodriguez Lupe L
Create a Home Valuation Report for This Property
The Home Valuation Report is an in-depth analysis detailing your home's value as well as a comparison with similar homes in the area
Home Values in the Area
Average Home Value in this Area
Purchase History
| Date | Buyer | Sale Price | Title Company |
|---|---|---|---|
| Rodriguez Marcos | -- | None Available | |
| Rodriguez Marcos | -- | -- | |
| Rodriguez Elizabeth Dianne | -- | -- | |
| Rodriguez Marcos | -- | -- | |
| Rodriguez Marcos | -- | -- |
Source: Public Records
Tax History
| Year | Tax Paid | Tax Assessment Tax Assessment Total Assessment is a certain percentage of the fair market value that is determined by local assessors to be the total taxable value of land and additions on the property. | Land | Improvement |
|---|---|---|---|---|
| 2025 | $1,396 | $206,000 | $60,000 | $146,000 |
| 2024 | $1,346 | $76,840 | $19,502 | $57,338 |
| 2023 | $1,346 | $75,335 | $19,120 | $56,215 |
| 2022 | $1,305 | $73,859 | $18,746 | $55,113 |
| 2021 | $1,131 | $72,412 | $18,379 | $54,033 |
| 2020 | $1,075 | $71,671 | $18,191 | $53,480 |
| 2019 | $1,060 | $71,671 | $18,191 | $53,480 |
| 2018 | $1,049 | $68,892 | $17,486 | $51,406 |
| 2017 | $1,055 | $67,543 | $17,144 | $50,399 |
| 2016 | $1,041 | $66,220 | $16,808 | $49,412 |
| 2015 | $1,070 | $65,227 | $16,556 | $48,671 |
| 2014 | $1,012 | $63,951 | $16,232 | $47,719 |
Source: Public Records
Map
Nearby Homes
Your Personal Tour Guide
Ask me questions while you tour the home.