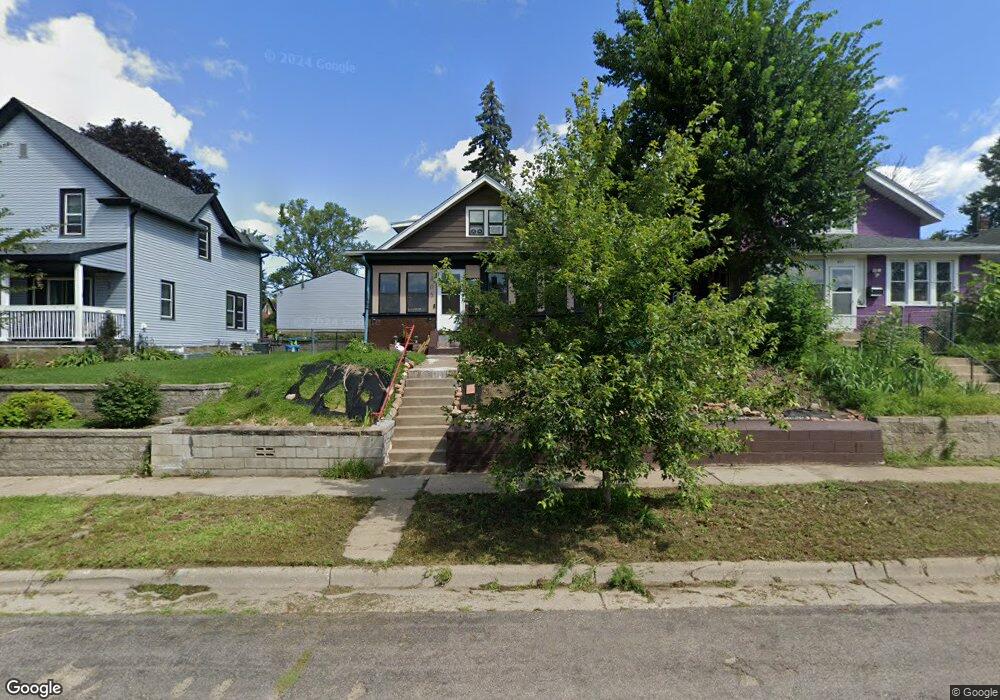
405 Hatch Ave Saint Paul, MN 55117
North End NeighborhoodEstimated Value: $236,000 - $303,000
4
Beds
2
Baths
1,331
Sq Ft
$201/Sq Ft
Est. Value
About This Home
This home is located at 405 Hatch Ave, Saint Paul, MN 55117 and is currently estimated at $267,975, approximately $201 per square foot. 405 Hatch Ave is a home located in Ramsey County with nearby schools including Como Park Elementary School, Murray Middle School, and Como Park Senior High School.
Ownership History
Date
Name
Owned For
Owner Type
Purchase Details
Closed on
Nov 1, 2021
Sold by
Fox Mike
Bought by
Corbecky Amy F
Current Estimated Value
Home Financials for this Owner
Home Financials are based on the most recent Mortgage that was taken out on this home.
Original Mortgage
$199,323
Outstanding Balance
$182,364
Interest Rate
2.88%
Mortgage Type
FHA
Estimated Equity
$85,611
Purchase Details
Closed on
May 13, 2014
Sold by
Federal National Mortgage Association
Bought by
Fox Mike
Purchase Details
Closed on
Feb 28, 2001
Sold by
Mcgovern Sadusky Investments
Bought by
Hendrix Nicole C and Hendrix Chad
Purchase Details
Closed on
Oct 24, 2000
Sold by
The Chase Manhattan Bank
Bought by
Mcgovern Sadusky Investments
Purchase Details
Closed on
Dec 9, 1997
Sold by
Preimesberger Jeffrey J and Preimesberger Julie M
Bought by
Bernin Carol
Purchase Details
Closed on
Dec 15, 1995
Sold by
Primes Benger Jeff
Bought by
Menard Donald and Bernin Carol M
Create a Home Valuation Report for This Property
The Home Valuation Report is an in-depth analysis detailing your home's value as well as a comparison with similar homes in the area
Home Values in the Area
Average Home Value in this Area
Purchase History
| Date | Buyer | Sale Price | Title Company |
|---|---|---|---|
| Corbecky Amy F | $203,000 | Legacy Title | |
| Fox Mike | -- | Title One Inc | |
| Hendrix Nicole C | $127,400 | -- | |
| Mcgovern Sadusky Investments | $58,900 | -- | |
| Bernin Carol | $64,900 | -- | |
| Menard Donald | $64,900 | -- |
Source: Public Records
Mortgage History
| Date | Status | Borrower | Loan Amount |
|---|---|---|---|
| Open | Corbecky Amy F | $199,323 | |
| Closed | Menard Donald | -- |
Source: Public Records
Tax History Compared to Growth
Tax History
| Year | Tax Paid | Tax Assessment Tax Assessment Total Assessment is a certain percentage of the fair market value that is determined by local assessors to be the total taxable value of land and additions on the property. | Land | Improvement |
|---|---|---|---|---|
| 2025 | $3,428 | $238,000 | $25,000 | $213,000 |
| 2023 | $3,428 | $224,000 | $20,000 | $204,000 |
| 2022 | $2,126 | $201,300 | $20,000 | $181,300 |
| 2021 | $3,180 | $148,700 | $20,000 | $128,700 |
| 2020 | $2,820 | $152,600 | $12,400 | $140,200 |
| 2019 | $2,308 | $141,700 | $12,400 | $129,300 |
| 2018 | $2,852 | $123,400 | $12,400 | $111,000 |
| 2017 | $2,136 | $115,600 | $12,400 | $103,200 |
| 2016 | $1,750 | $0 | $0 | $0 |
| 2015 | $1,502 | $84,700 | $12,400 | $72,300 |
| 2014 | $1,460 | $0 | $0 | $0 |
Source: Public Records
Map
Nearby Homes
- 956 Western Ave N
- 1040 Cumberland St
- 359 Stinson St W
- 1083 Western Ave N
- 916 Farrington St
- 1067 Farrington St
- 283 Front Ave
- 310 Burgess St
- 306 Burgess St
- 1071 Matilda St
- 1110 Virginia St
- 954 Galtier St
- 1011 Marion St
- 1104 MacKubin St
- 950 Marion St
- 552 Burgess St
- 569 Hatch Ave
- 1049 Kent St
- 964 Woodbridge St
- 1175 Arundel St
- 405 405 Hatch Ave
- 403 Hatch Ave
- 413 Hatch Ave
- 399 Hatch Ave
- 399 399 Hatch-Avenue-
- 399 399 Hatch Ave
- 417 417 Hatch-Avenue-
- 417 Hatch Ave
- 421 Hatch Ave
- 393 Hatch Ave
- 393 393 Hatch Ave
- 400 Lawson Ave W
- 410 Lawson Ave W
- 398 Lawson Ave W
- 398 398 Lawson-Avenue-w
- 408 Hatch Ave
- 408 408 Hatch-Avenue-
- 404 Hatch Ave
- 404 404 Hatch Ave
- 410 Hatch Ave