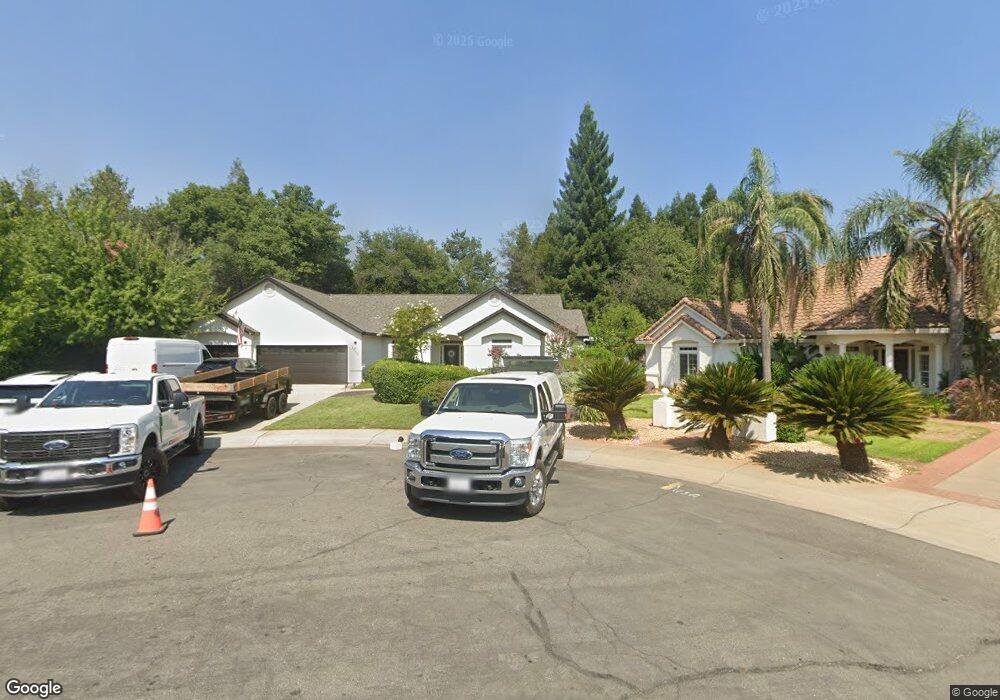
4050 Aspen Springs Ct Redding, CA 96002
Goodwater NeighborhoodEstimated Value: $508,000 - $588,000
3
Beds
3
Baths
2,132
Sq Ft
$262/Sq Ft
Est. Value
About This Home
This home is located at 4050 Aspen Springs Ct, Redding, CA 96002 and is currently estimated at $559,461, approximately $262 per square foot. 4050 Aspen Springs Ct is a home located in Shasta County with nearby schools including Prairie Elementary School, Pacheco Elementary School, and California Heritage Youth Build Academy.
Ownership History
Date
Name
Owned For
Owner Type
Purchase Details
Closed on
Sep 16, 2024
Sold by
Wilkens Family Trust and Wilkens Dann J
Bought by
Riverbank Financial Llc
Current Estimated Value
Home Financials for this Owner
Home Financials are based on the most recent Mortgage that was taken out on this home.
Original Mortgage
$380,000
Outstanding Balance
$375,720
Interest Rate
6.46%
Mortgage Type
New Conventional
Estimated Equity
$183,741
Purchase Details
Closed on
Feb 16, 2017
Sold by
Wilkens Frank Verd and Wilkens Shirley Ann
Bought by
Wilkens Frank Verd and Wilkens Shirley Ann
Home Financials for this Owner
Home Financials are based on the most recent Mortgage that was taken out on this home.
Original Mortgage
$147,000
Interest Rate
4.12%
Mortgage Type
New Conventional
Purchase Details
Closed on
Apr 8, 2004
Sold by
Wilkens Francis V and Wilkens Shirley A
Bought by
Wilkens Francis Verd and Wilkens Shirley Ann
Purchase Details
Closed on
Feb 24, 2003
Sold by
Martin Richard Charles and Martin Jo Ann Mildred
Bought by
Wilkens Francis and Wilkens Shirley A
Purchase Details
Closed on
Oct 2, 2001
Sold by
Martin Richard C and Martin Jo Ann M
Bought by
Martin Richard Charles and Martin Joann Mildred
Purchase Details
Closed on
Aug 22, 2000
Sold by
Clark 1994 Trust and Allie M
Bought by
Martin Richard C and Martin Joann
Home Financials for this Owner
Home Financials are based on the most recent Mortgage that was taken out on this home.
Original Mortgage
$202,000
Interest Rate
8.2%
Mortgage Type
Seller Take Back
Purchase Details
Closed on
May 3, 1999
Sold by
Allen Jeb and Tsai Sue
Bought by
Martin Richard C and Martin Joann M
Home Financials for this Owner
Home Financials are based on the most recent Mortgage that was taken out on this home.
Original Mortgage
$154,592
Interest Rate
6.61%
Create a Home Valuation Report for This Property
The Home Valuation Report is an in-depth analysis detailing your home's value as well as a comparison with similar homes in the area
Home Values in the Area
Average Home Value in this Area
Purchase History
| Date | Buyer | Sale Price | Title Company |
|---|---|---|---|
| Riverbank Financial Llc | $557,000 | Chicago Title | |
| Wilkens Frank Verd | -- | First American Title Company | |
| Wilkens Frank Verd | -- | First American Title Company | |
| Wilkens Francis Verd | -- | -- | |
| Wilkens Francis | $329,000 | Fidelity National Title Co | |
| Martin Richard Charles | -- | -- | |
| Martin Richard Charles | -- | -- | |
| Martin Richard C | $252,000 | Chicago Title Co | |
| Martin Richard C | $190,500 | Placer Title Company |
Source: Public Records
Mortgage History
| Date | Status | Borrower | Loan Amount |
|---|---|---|---|
| Open | Riverbank Financial Llc | $380,000 | |
| Previous Owner | Wilkens Frank Verd | $147,000 | |
| Previous Owner | Martin Richard C | $202,000 | |
| Previous Owner | Martin Richard C | $154,592 |
Source: Public Records
Tax History Compared to Growth
Tax History
| Year | Tax Paid | Tax Assessment Tax Assessment Total Assessment is a certain percentage of the fair market value that is determined by local assessors to be the total taxable value of land and additions on the property. | Land | Improvement |
|---|---|---|---|---|
| 2025 | $4,759 | $556,750 | $80,000 | $476,750 |
| 2024 | $4,665 | $445,795 | $100,987 | $344,808 |
| 2023 | $4,665 | $437,055 | $99,007 | $338,048 |
| 2022 | $4,548 | $428,486 | $97,066 | $331,420 |
| 2021 | $4,477 | $420,085 | $95,163 | $324,922 |
| 2020 | $4,423 | $415,779 | $94,188 | $321,591 |
| 2019 | $4,367 | $407,628 | $92,342 | $315,286 |
| 2018 | $4,195 | $399,636 | $90,532 | $309,104 |
| 2017 | $4,254 | $391,801 | $88,757 | $303,044 |
| 2016 | $4,024 | $384,119 | $87,017 | $297,102 |
| 2015 | $4,019 | $378,350 | $85,710 | $292,640 |
| 2014 | $3,589 | $335,000 | $80,000 | $255,000 |
Source: Public Records
Map
Nearby Homes
- 3849 Capricorn Way
- 4151 Saratoga Dr
- 2408 Castlewood Dr
- 3792 Thomason Trail
- 2796 Madison River Dr
- 3688 Polaris Way
- 2269 Corona St
- 3512 Capricorn Way
- 2877 Green Riffle Rd
- 2366 Templeton Dr
- 3685 Wimbledon Dr
- 3863 Indian Wells Ln
- 4655 Goodwater Ave
- 3195 Forest Hills Dr
- 2608 La Rinconada Place
- 4810 Rising River Ct
- 2364 La Madre Ct
- 2145 Venus Way
- 4813 St Charles Dr
- 3387 Bridger Dr
- 4090 Aspen Springs Ct
- 4030 Aspen Springs Ct
- 4047 Cloverway Dr
- 4087 Cloverway Dr
- 4007 Cloverway Dr
- 4035 Aspen Springs Ct
- 4095 Aspen Springs Ct Unit LOT 6
- 4095 Aspen Springs Ct
- 4055 Aspen Springs Ct
- 4110 Aspen Springs Ct
- 0 Aspen Springs Ct
- 4105 Cloverway Dr
- 2690 Castlewood Dr
- 2675 Castlewood Dr
- 2598 Eastbrook 4% To So
- 2598 Eastbrook Dr
- 4125 Aspen Springs Ct
- 4130 Aspen Springs Ct Unit LOT 18
- 4130 Aspen Springs Ct
- 4080 Mount Whitney Way