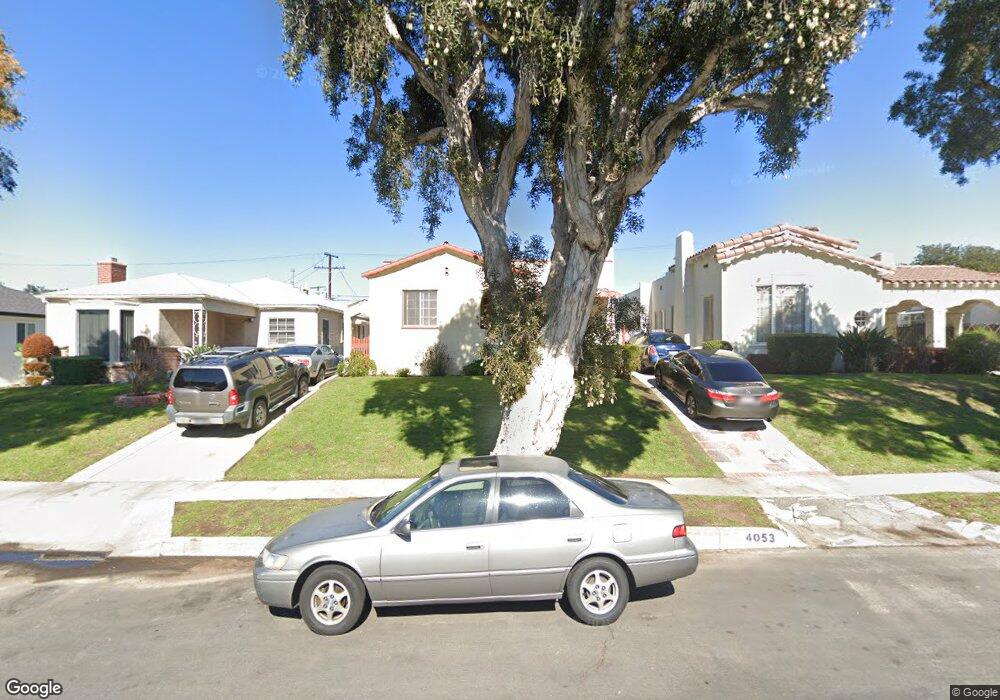
4053 W 59th St Los Angeles, CA 90043
Hyde Park NeighborhoodEstimated Value: $981,153 - $1,241,000
2
Beds
2
Baths
1,366
Sq Ft
$819/Sq Ft
Est. Value
About This Home
This home is located at 4053 W 59th St, Los Angeles, CA 90043 and is currently estimated at $1,118,788, approximately $819 per square foot. 4053 W 59th St is a home located in Los Angeles County with nearby schools including Fifty-Fourth Street Elementary School, Audubon Middle School, and Crenshaw Science, Technology, Engineering, Math And Medicine Magnet.
Ownership History
Date
Name
Owned For
Owner Type
Purchase Details
Closed on
Dec 21, 2024
Sold by
Finley Trust and Finley Stephen
Bought by
Finley Stephen and Finley Linda
Current Estimated Value
Purchase Details
Closed on
Jul 31, 2020
Sold by
Finley Stephen P and Finley Linda
Bought by
Finley Stephen P and Finley Linda
Home Financials for this Owner
Home Financials are based on the most recent Mortgage that was taken out on this home.
Original Mortgage
$504,367
Interest Rate
3.1%
Mortgage Type
VA
Purchase Details
Closed on
Aug 15, 2019
Sold by
Finley Stephen P and Finley Linda
Bought by
Finley Stephen P and Finley Linda
Home Financials for this Owner
Home Financials are based on the most recent Mortgage that was taken out on this home.
Original Mortgage
$500,000
Interest Rate
3.7%
Mortgage Type
VA
Purchase Details
Closed on
Feb 3, 2017
Sold by
Finley Stephen P
Bought by
Finley Stephen P and Finley Linda
Home Financials for this Owner
Home Financials are based on the most recent Mortgage that was taken out on this home.
Original Mortgage
$489,000
Interest Rate
4.12%
Mortgage Type
VA
Purchase Details
Closed on
Jun 24, 2016
Sold by
Finley Stephen Phillip
Bought by
The Finley Trust
Home Financials for this Owner
Home Financials are based on the most recent Mortgage that was taken out on this home.
Original Mortgage
$450,000
Interest Rate
3.58%
Mortgage Type
FHA
Purchase Details
Closed on
Jun 16, 2016
Sold by
Finley Stephen P
Bought by
Finley Stephen Phillip and Finley Linda S
Home Financials for this Owner
Home Financials are based on the most recent Mortgage that was taken out on this home.
Original Mortgage
$450,000
Interest Rate
3.58%
Mortgage Type
FHA
Purchase Details
Closed on
Oct 8, 2015
Sold by
Finley Stephen Phillip
Bought by
Finley Trust
Purchase Details
Closed on
Feb 11, 2014
Sold by
Finley Linda S
Bought by
Finley Stephen Phillip and Finley Linda S
Purchase Details
Closed on
Apr 18, 2012
Sold by
Finley Stephen Phillip
Bought by
Finley Linda S
Purchase Details
Closed on
Dec 10, 2002
Sold by
Finley Stephen Phillip
Bought by
Finley Stephen Phillip
Home Financials for this Owner
Home Financials are based on the most recent Mortgage that was taken out on this home.
Original Mortgage
$285,600
Interest Rate
6.06%
Create a Home Valuation Report for This Property
The Home Valuation Report is an in-depth analysis detailing your home's value as well as a comparison with similar homes in the area
Home Values in the Area
Average Home Value in this Area
Purchase History
| Date | Buyer | Sale Price | Title Company |
|---|---|---|---|
| Finley Stephen | -- | None Listed On Document | |
| Finley Stephen P | -- | None Available | |
| Finley Stephen P | -- | Title Resource Guaranty Co | |
| Finley Stephen P | -- | Fidelity National Title Co | |
| Finley Stephen P | -- | Fidelity National Title Co | |
| Finley Stephen P | -- | Accommodation | |
| Finley Stephen P | -- | Fidelity National Title | |
| The Finley Trust | -- | Fidelity National Title Co | |
| Finley Stephen Phillip | -- | Fidelity National Title | |
| Finley Trust | -- | None Available | |
| Finley Stephen Phillip | -- | None Available | |
| Finley Linda S | -- | None Available | |
| Finley Stephen Phillip | -- | Fidelity | |
| Finley Stephen Phillip | -- | Financial Title Company | |
| Finley Stephen Phillip | -- | Financial Title Company |
Source: Public Records
Mortgage History
| Date | Status | Borrower | Loan Amount |
|---|---|---|---|
| Previous Owner | Finley Stephen P | $504,367 | |
| Previous Owner | Finley Stephen P | $500,000 | |
| Previous Owner | Finley Stephen P | $489,000 | |
| Previous Owner | Finley Stephen Phillip | $450,000 | |
| Previous Owner | Finley Stephen Phillip | $285,600 |
Source: Public Records
Tax History Compared to Growth
Tax History
| Year | Tax Paid | Tax Assessment Tax Assessment Total Assessment is a certain percentage of the fair market value that is determined by local assessors to be the total taxable value of land and additions on the property. | Land | Improvement |
|---|---|---|---|---|
| 2025 | $1,987 | $131,317 | $45,275 | $86,042 |
| 2024 | $1,987 | $128,743 | $44,388 | $84,355 |
| 2023 | $1,956 | $126,219 | $43,518 | $82,701 |
| 2022 | $1,880 | $123,745 | $42,665 | $81,080 |
| 2021 | $1,846 | $121,320 | $41,829 | $79,491 |
| 2019 | $1,797 | $117,724 | $40,590 | $77,134 |
| 2018 | $1,737 | $115,417 | $39,795 | $75,622 |
| 2016 | $1,650 | $110,937 | $38,250 | $72,687 |
| 2015 | $1,625 | $109,272 | $37,676 | $71,596 |
| 2014 | $1,636 | $107,132 | $36,938 | $70,194 |
Source: Public Records
Map
Nearby Homes
- 4137 W 58th Place
- 4243 W 58th Place
- 4254 W 58th Place
- 4263 W 59th St
- 5709 Alviso Ave
- 3854 W 59th St
- 5659 Valley Glen Way
- 4104 Charlene Dr
- 4313 W 59th St
- 4325 W 58th Place
- 3831 W 60th St
- 4329 W 58th Place
- 4210 W 62nd St
- 3815 W 60th St
- 3749 W 59th St
- 6018 S Harcourt Ave
- 4408 W 59th St
- 3961 W 64th St
- 4440 W 58th Place
- 3932 W 64th St
- 4049 W 59th St
- 4057 W 59th St
- 4045 W 59th St
- 4061 W 59th St
- 5860 S Verdun Ave
- 5876 S Verdun Ave
- 4041 W 59th St
- 4050 W 58th Place
- 4044 W 58th Place
- 4054 W 58th Place
- 4037 W 59th St
- 4040 W 58th Place
- 4052 W 59th St
- 4048 W 59th St
- 4033 W 59th St
- 4056 W 59th St
- 5875 S Verdun Ave
- 4036 W 58th Place
- 4044 W 59th St
- 4060 W 59th St