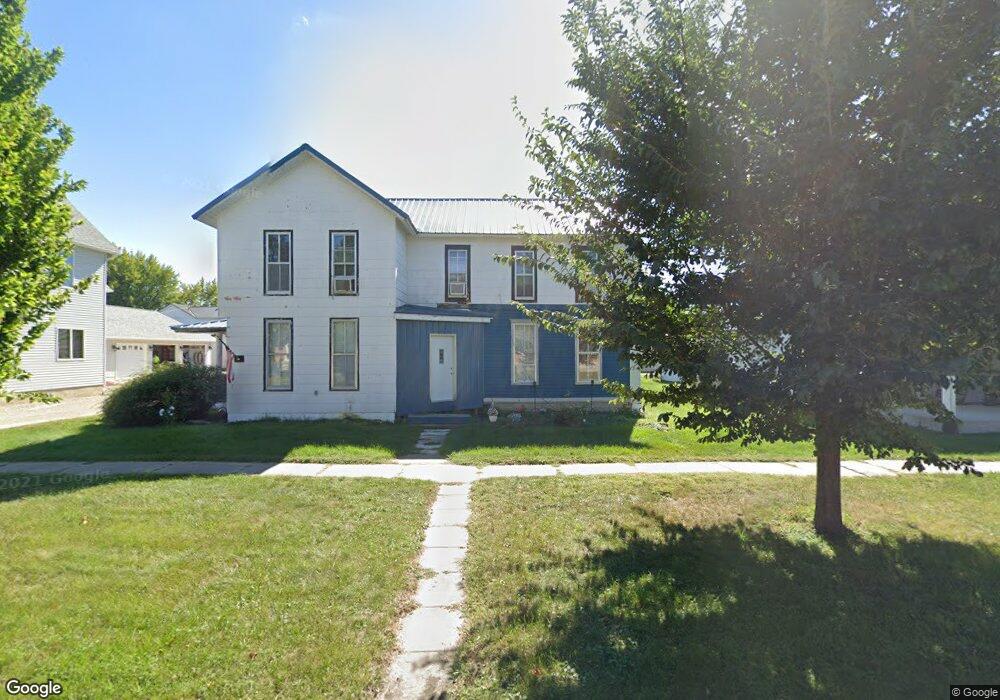
406 E 4th St Vinton, IA 52349
Estimated Value: $111,000 - $145,000
5
Beds
2
Baths
2,702
Sq Ft
$47/Sq Ft
Est. Value
About This Home
This home is located at 406 E 4th St, Vinton, IA 52349 and is currently estimated at $128,094, approximately $47 per square foot. 406 E 4th St is a home with nearby schools including Tilford Elementary School, Vinton-Shellsburg Middle School, and Vinton-Shellsburg High School.
Ownership History
Date
Name
Owned For
Owner Type
Purchase Details
Closed on
Sep 26, 2023
Sold by
Stueck Lois M
Bought by
Olson Benjamin J and Olson Amy R
Current Estimated Value
Purchase Details
Closed on
Feb 22, 2007
Sold by
Rommann Dolores and Hopper Tressa I
Bought by
Williams Richard C and Williams Crystal N
Home Financials for this Owner
Home Financials are based on the most recent Mortgage that was taken out on this home.
Original Mortgage
$45,000
Interest Rate
6.27%
Mortgage Type
Future Advance Clause Open End Mortgage
Purchase Details
Closed on
Jun 28, 2005
Sold by
Hopper Tresssa Irene
Bought by
Williams Richard C and Williams Crystal N
Create a Home Valuation Report for This Property
The Home Valuation Report is an in-depth analysis detailing your home's value as well as a comparison with similar homes in the area
Home Values in the Area
Average Home Value in this Area
Purchase History
| Date | Buyer | Sale Price | Title Company |
|---|---|---|---|
| Olson Benjamin J | $1,082,000 | None Listed On Document | |
| Williams Richard C | $60,000 | None Available | |
| Williams Richard C | $60,000 | None Available |
Source: Public Records
Mortgage History
| Date | Status | Borrower | Loan Amount |
|---|---|---|---|
| Previous Owner | Williams Richard C | $45,000 | |
| Closed | Williams Richard C | $0 |
Source: Public Records
Tax History
| Year | Tax Paid | Tax Assessment Tax Assessment Total Assessment is a certain percentage of the fair market value that is determined by local assessors to be the total taxable value of land and additions on the property. | Land | Improvement |
|---|---|---|---|---|
| 2025 | $586 | $70,400 | $15,200 | $55,200 |
| 2024 | $586 | $63,600 | $14,600 | $49,000 |
| 2023 | $942 | $63,600 | $14,600 | $49,000 |
| 2022 | $964 | $56,000 | $11,600 | $44,400 |
| 2021 | $964 | $56,000 | $11,600 | $44,400 |
| 2020 | $1,070 | $61,600 | $12,900 | $48,700 |
| 2019 | $1,362 | $61,600 | $12,900 | $48,700 |
| 2018 | $1,318 | $73,900 | $12,400 | $61,500 |
| 2017 | $1,318 | $73,900 | $12,400 | $61,500 |
| 2016 | $1,232 | $69,100 | $11,600 | $57,500 |
| 2015 | $1,232 | $69,100 | $11,600 | $57,500 |
| 2014 | $1,210 | $68,000 | $0 | $0 |
Source: Public Records
Map
Nearby Homes
Your Personal Tour Guide
Ask me questions while you tour the home.