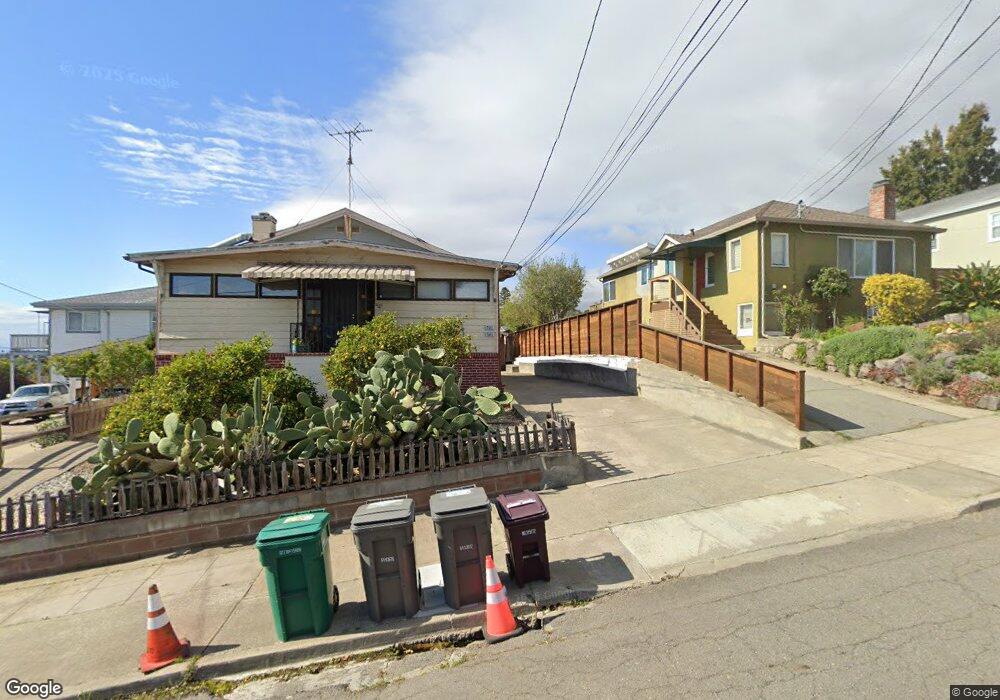
4061 39th Ave Oakland, CA 94619
Redwood Heights NeighborhoodEstimated Value: $1,238,000 - $1,572,000
2
Beds
1
Bath
1,320
Sq Ft
$1,064/Sq Ft
Est. Value
About This Home
This home is located at 4061 39th Ave, Oakland, CA 94619 and is currently estimated at $1,405,000, approximately $1,064 per square foot. 4061 39th Ave is a home located in Alameda County with nearby schools including Laurel Elementary School, Bret Harte Middle School, and Skyline High School.
Ownership History
Date
Name
Owned For
Owner Type
Purchase Details
Closed on
Dec 21, 2023
Sold by
Seritis Dna
Bought by
Dna M Seritis Trust and Seritis
Current Estimated Value
Purchase Details
Closed on
Feb 29, 2012
Sold by
Nteves Assimo and The Nikolaos Zeritis Living Tr
Bought by
Seritis Dina
Purchase Details
Closed on
Jul 24, 2006
Sold by
Zeritis Nikolaos G and Nikolaos Zeritis Living Trust
Bought by
Zeritis Nikolaos G and Nikolaos Zeritis Living Trust
Purchase Details
Closed on
May 4, 2004
Sold by
Zeritis Nikoloas G
Bought by
Zeritis Nikolaos G and Nikolaos Zeritis Living Trust
Purchase Details
Closed on
Aug 31, 2000
Sold by
Sampson Avelina V and Avelina V Sampson Trust
Bought by
Zeritis Nikolaos G and Seritis Nikolaos G
Purchase Details
Closed on
Sep 3, 1996
Sold by
Sampson Avelina
Bought by
Sampson Avelina V and The Avelina Sampson Living Tru
Purchase Details
Closed on
Jun 24, 1996
Sold by
Seritis Nikolaus
Bought by
Seritis Nikolaus
Create a Home Valuation Report for This Property
The Home Valuation Report is an in-depth analysis detailing your home's value as well as a comparison with similar homes in the area
Home Values in the Area
Average Home Value in this Area
Purchase History
| Date | Buyer | Sale Price | Title Company |
|---|---|---|---|
| Dna M Seritis Trust | -- | None Listed On Document | |
| Seritis Dina | -- | None Available | |
| Zeritis Nikolaos G | -- | None Available | |
| Zeritis Nikolaos G | -- | -- | |
| Zeritis Nikolaos G | -- | -- | |
| Sampson Avelina V | -- | -- | |
| Seritis Nikolaus | -- | -- |
Source: Public Records
Tax History
| Year | Tax Paid | Tax Assessment Tax Assessment Total Assessment is a certain percentage of the fair market value that is determined by local assessors to be the total taxable value of land and additions on the property. | Land | Improvement |
|---|---|---|---|---|
| 2025 | $4,503 | $81,889 | $50,752 | $31,137 |
| 2024 | $4,503 | $80,284 | $49,757 | $30,527 |
| 2023 | $4,445 | $78,709 | $48,781 | $29,928 |
| 2022 | $4,078 | $77,166 | $47,825 | $29,341 |
| 2021 | $3,530 | $75,653 | $46,887 | $28,766 |
| 2020 | $3,474 | $74,877 | $46,406 | $28,471 |
| 2019 | $3,105 | $73,409 | $45,496 | $27,913 |
| 2018 | $3,028 | $71,970 | $44,604 | $27,366 |
| 2017 | $2,809 | $70,559 | $43,730 | $26,829 |
| 2016 | $2,626 | $69,176 | $42,873 | $26,303 |
| 2015 | $2,595 | $68,137 | $42,229 | $25,908 |
| 2014 | $2,444 | $66,802 | $41,401 | $25,401 |
Source: Public Records
Map
Nearby Homes
- 3824 39th Ave Unit C
- 4131 Bayo St
- 3859 High St
- 3714 Magee Ave
- 3661 Loma Vista Ave
- 3363 Kiwanis St
- 4160 Masterson St
- 3932 Macarthur Blvd
- 3723 35th Ave
- 3753 Midvale Ave
- 3332 Victor Ave
- 4663 Fair Ave
- 3900 Laurel Ave
- 4628 Fieldbrook Rd
- 3316 Macarthur Blvd
- 3330 Monterey Blvd
- 4239 Quigley Place
- 3257 Monterey Blvd
- 4671 Stauffer Place
- 4475 Redding St
Your Personal Tour Guide
Ask me questions while you tour the home.