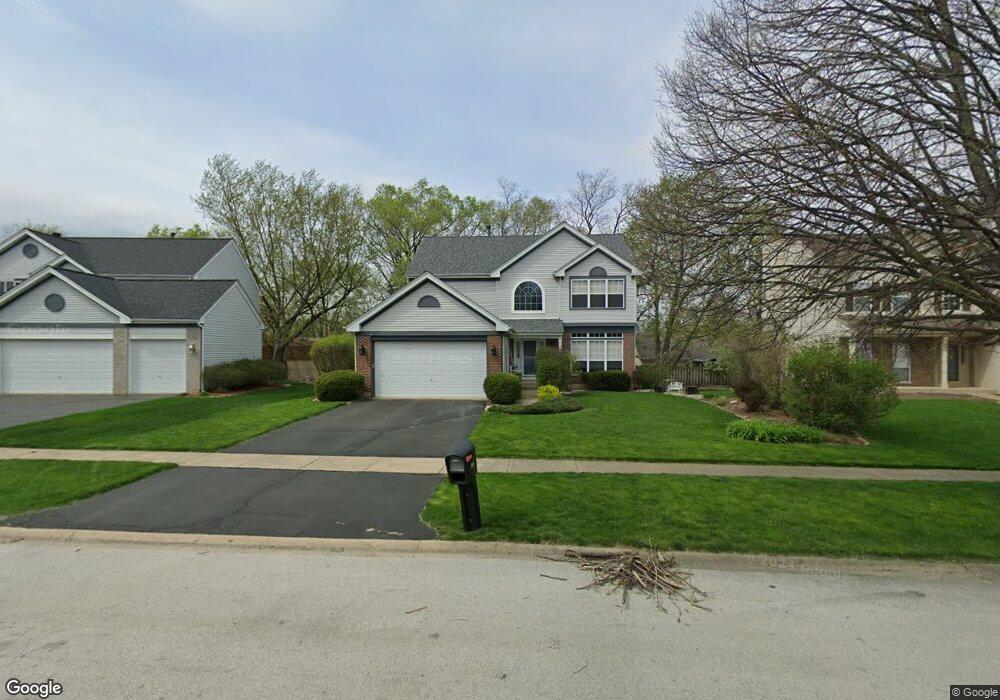
407 Joseph Ct Oswego, IL 60543
North Oswego NeighborhoodEstimated Value: $425,851 - $451,000
4
Beds
3
Baths
2,132
Sq Ft
$205/Sq Ft
Est. Value
About This Home
This home is located at 407 Joseph Ct, Oswego, IL 60543 and is currently estimated at $436,713, approximately $204 per square foot. 407 Joseph Ct is a home located in Kendall County with nearby schools including Old Post Elementary School, Thompson Jr. High School, and Oswego High School.
Ownership History
Date
Name
Owned For
Owner Type
Purchase Details
Closed on
Nov 29, 1999
Sold by
Kimball Hill Inc
Bought by
Noehre Cary A and Noehre Deborah B
Current Estimated Value
Home Financials for this Owner
Home Financials are based on the most recent Mortgage that was taken out on this home.
Original Mortgage
$178,000
Interest Rate
7.62%
Purchase Details
Closed on
Jul 30, 1999
Sold by
Inland Land Appreciation Fund Ii Lp
Bought by
Kimball Hill Inc
Create a Home Valuation Report for This Property
The Home Valuation Report is an in-depth analysis detailing your home's value as well as a comparison with similar homes in the area
Home Values in the Area
Average Home Value in this Area
Purchase History
| Date | Buyer | Sale Price | Title Company |
|---|---|---|---|
| Noehre Cary A | $193,000 | Stewart Title Company | |
| Kimball Hill Inc | $78,500 | Chicago Title Insurance Co |
Source: Public Records
Mortgage History
| Date | Status | Borrower | Loan Amount |
|---|---|---|---|
| Closed | Noehre Cary A | $178,000 |
Source: Public Records
Tax History Compared to Growth
Tax History
| Year | Tax Paid | Tax Assessment Tax Assessment Total Assessment is a certain percentage of the fair market value that is determined by local assessors to be the total taxable value of land and additions on the property. | Land | Improvement |
|---|---|---|---|---|
| 2024 | $8,997 | $117,803 | $27,398 | $90,405 |
| 2023 | $8,016 | $104,250 | $24,246 | $80,004 |
| 2022 | $8,016 | $94,773 | $22,042 | $72,731 |
| 2021 | $7,726 | $88,573 | $20,600 | $67,973 |
| 2020 | $7,559 | $85,993 | $20,000 | $65,993 |
| 2019 | $7,435 | $83,455 | $20,000 | $63,455 |
| 2018 | $7,370 | $80,361 | $19,429 | $60,932 |
| 2017 | $7,306 | $77,270 | $18,682 | $58,588 |
| 2016 | $7,255 | $75,755 | $18,316 | $57,439 |
| 2015 | $7,369 | $73,549 | $17,783 | $55,766 |
| 2014 | $7,551 | $71,407 | $17,265 | $54,142 |
| 2013 | $7,551 | $72,128 | $17,439 | $54,689 |
Source: Public Records
Map
Nearby Homes
- 39 Cayman Dr
- 4 Circle Ct
- 47 Old Post Rd
- 40 Codorus Rd
- 19 Wyndham Dr Unit 10
- 30 Hampton Rd
- 28 Seneca Dr
- 9 Cebold Dr
- 22 Sherwick Rd
- 3 Scarsdale Rd
- 73 Ingleshire Rd
- 34 Pembrooke Rd
- 117 Boulder Hill Pass Unit 117
- 119 Garden Dr
- 29 Briarcliff Rd
- 420 Chesterfield Ct Unit 420
- 60 Fernwood Rd
- 215 Fernwood Rd
- 3 Orchard Rd
- 123 Orchard Rd