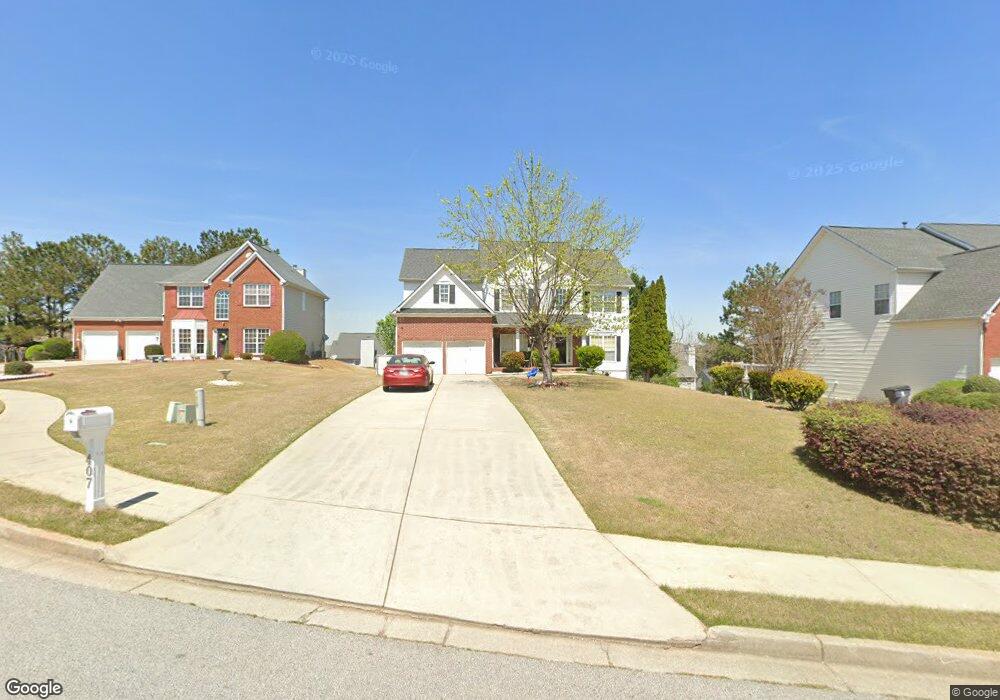
407 Payton Ct Stockbridge, GA 30281
Estimated Value: $294,000 - $415,000
5
Beds
3
Baths
1,443
Sq Ft
$262/Sq Ft
Est. Value
About This Home
This home is located at 407 Payton Ct, Stockbridge, GA 30281 and is currently estimated at $378,062, approximately $261 per square foot. 407 Payton Ct is a home located in Henry County with nearby schools including Red Oak Elementary School, Dutchtown Middle School, and Dutchtown High School.
Ownership History
Date
Name
Owned For
Owner Type
Purchase Details
Closed on
Aug 10, 2023
Sold by
Singh Manpreet
Bought by
Kaur Paramjeet
Current Estimated Value
Purchase Details
Closed on
May 15, 2017
Sold by
Singh Jaswant
Bought by
Singh Manpreet
Purchase Details
Closed on
Feb 23, 2005
Sold by
Valentine Paula K
Bought by
Walker Lorette I
Home Financials for this Owner
Home Financials are based on the most recent Mortgage that was taken out on this home.
Original Mortgage
$231,318
Interest Rate
5.61%
Mortgage Type
VA
Purchase Details
Closed on
Dec 28, 2000
Sold by
Mccar Dev Corp
Bought by
Valentine Paula K
Home Financials for this Owner
Home Financials are based on the most recent Mortgage that was taken out on this home.
Original Mortgage
$172,800
Interest Rate
7.65%
Mortgage Type
New Conventional
Create a Home Valuation Report for This Property
The Home Valuation Report is an in-depth analysis detailing your home's value as well as a comparison with similar homes in the area
Home Values in the Area
Average Home Value in this Area
Purchase History
| Date | Buyer | Sale Price | Title Company |
|---|---|---|---|
| Kaur Paramjeet | -- | -- | |
| Singh Manpreet | -- | -- | |
| Walker Lorette I | $239,900 | -- | |
| Valentine Paula K | $216,000 | -- |
Source: Public Records
Mortgage History
| Date | Status | Borrower | Loan Amount |
|---|---|---|---|
| Previous Owner | Walker Lorette I | $231,318 | |
| Previous Owner | Valentine Paula K | $172,800 |
Source: Public Records
Tax History Compared to Growth
Tax History
| Year | Tax Paid | Tax Assessment Tax Assessment Total Assessment is a certain percentage of the fair market value that is determined by local assessors to be the total taxable value of land and additions on the property. | Land | Improvement |
|---|---|---|---|---|
| 2025 | $6,813 | $167,680 | $18,000 | $149,680 |
| 2024 | $6,813 | $166,320 | $18,000 | $148,320 |
| 2023 | $6,914 | $165,840 | $14,000 | $151,840 |
| 2022 | $5,221 | $130,000 | $14,000 | $116,000 |
| 2021 | $4,127 | $101,280 | $12,000 | $89,280 |
| 2020 | $4,063 | $99,600 | $10,000 | $89,600 |
| 2019 | $3,426 | $87,360 | $10,000 | $77,360 |
| 2018 | $3,426 | $84,640 | $10,000 | $74,640 |
| 2016 | $3,151 | $77,480 | $9,200 | $68,280 |
| 2015 | $2,929 | $69,520 | $7,200 | $62,320 |
| 2014 | $2,898 | $67,920 | $6,000 | $61,920 |
Source: Public Records
Map
Nearby Homes
- 568 Ransom Way
- 705 Brentwood Pkwy
- 200 Ernestine Way
- 117 Titan Rd
- 404 Northwind Place
- 512 Chaucer Way Unit 1
- 223 Monarch Village Way
- 263 Northwind Dr
- 328 Spring Creek Dr
- 602 Brookwater Dr
- 213 Sunderland Way Unit 1
- 623 Brookwater Dr
- 540 Anglewood Trace
- 266 Monarch Village Way
- 212 Addy Ln
- 300 Monarch Village Way
- 677 Armitage Way
- 5005 Kens Ct
- 687 Pathwood Ln
- 809 Winsap Dr
- 409 Payton Ct
- 405 Payton Ct
- 408 Gresham Dr
- 406 Gresham Dr
- 410 Gresham Dr
- 411 Payton Ct
- 404 Gresham Dr
- 404 Gresham Dr
- 404 Gresham Dr Unit 1200
- 404 Gresham Dr Unit 3
- 412 Gresham Dr
- 403 Payton Ct
- 406 Payton Ct
- 402 Gresham Dr
- 404 Payton Ct
- 408 Payton Ct
- 401 Payton Ct
- 413 Payton Ct
- 414 Gresham Dr
- 402 Payton Ct