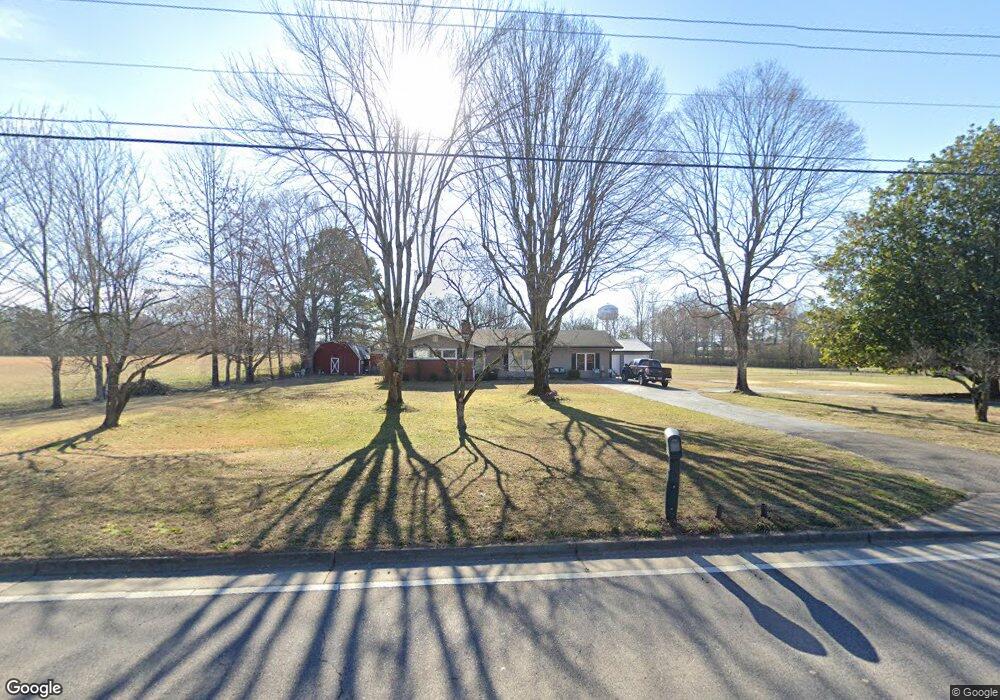
408 N Military St Loretto, TN 38469
Estimated Value: $217,000 - $234,000
--
Bed
1
Bath
1,812
Sq Ft
$124/Sq Ft
Est. Value
About This Home
This home is located at 408 N Military St, Loretto, TN 38469 and is currently estimated at $224,697, approximately $124 per square foot. 408 N Military St is a home located in Lawrence County with nearby schools including South Lawrence Elementary School, Lawrenceburg Public Elementary School, and Ingram Sowell Elementary School.
Ownership History
Date
Name
Owned For
Owner Type
Purchase Details
Closed on
Jan 15, 2016
Sold by
Hutton George
Bought by
Landtroop Eddie and Landtroop Carol
Current Estimated Value
Home Financials for this Owner
Home Financials are based on the most recent Mortgage that was taken out on this home.
Original Mortgage
$228,550
Outstanding Balance
$181,949
Interest Rate
3.99%
Mortgage Type
New Conventional
Estimated Equity
$42,748
Purchase Details
Closed on
Jun 28, 2011
Sold by
Springer Kenneth Owen
Bought by
Hutton George and Hutton Judith
Home Financials for this Owner
Home Financials are based on the most recent Mortgage that was taken out on this home.
Original Mortgage
$60,075
Interest Rate
4.57%
Mortgage Type
Commercial
Purchase Details
Closed on
May 7, 1991
Bought by
Springer Herbert
Purchase Details
Closed on
Nov 3, 1979
Bought by
Springer Herbert and Springer Wife
Create a Home Valuation Report for This Property
The Home Valuation Report is an in-depth analysis detailing your home's value as well as a comparison with similar homes in the area
Home Values in the Area
Average Home Value in this Area
Purchase History
| Date | Buyer | Sale Price | Title Company |
|---|---|---|---|
| Landtroop Eddie | $77,000 | -- | |
| Hutton George | $67,500 | -- | |
| Springer Herbert | -- | -- | |
| Springer Herbert | -- | -- |
Source: Public Records
Mortgage History
| Date | Status | Borrower | Loan Amount |
|---|---|---|---|
| Open | Landtroop Eddie | $228,550 | |
| Previous Owner | Hutton George | $60,075 |
Source: Public Records
Tax History Compared to Growth
Tax History
| Year | Tax Paid | Tax Assessment Tax Assessment Total Assessment is a certain percentage of the fair market value that is determined by local assessors to be the total taxable value of land and additions on the property. | Land | Improvement |
|---|---|---|---|---|
| 2024 | $835 | $35,675 | $2,650 | $33,025 |
| 2023 | $835 | $35,675 | $2,650 | $33,025 |
| 2022 | $835 | $35,675 | $2,650 | $33,025 |
| 2021 | $675 | $20,100 | $2,700 | $17,400 |
| 2020 | $675 | $20,100 | $2,700 | $17,400 |
| 2019 | $675 | $20,100 | $2,700 | $17,400 |
| 2018 | $665 | $20,100 | $2,700 | $17,400 |
| 2017 | $645 | $20,100 | $2,700 | $17,400 |
| 2016 | $645 | $20,100 | $2,700 | $17,400 |
| 2015 | $589 | $20,100 | $2,700 | $17,400 |
| 2014 | $603 | $20,600 | $2,700 | $17,900 |
Source: Public Records
Map
Nearby Homes
- 502 N Main St
- 119 Horn Ave
- 219 Vine Cir
- 308 Spring St
- 110 W Commerce St
- 191 Rigling Rd
- 0 Henkle Rd Unit RTC2592696
- 0 Henkle Rd Unit RTC2592694
- 0 Henkle Rd Unit RTC2452834
- 703 Brenda Ave
- 0 Dixon Branch Rd
- 716 Brenda Ave
- 163 Rigling Rd
- 110 4th Ave
- 402 W Commerce St
- 24 Henkle Ln
- 105 McGee Ln
- 746 N Military St
- 116 Smith Cir
- 565 Eagle Loop
- 404 N Military St
- 409 N Military St
- 402 N Military St
- 105 Delores St
- 113 Delores St
- 115 Delores St
- E Augustine Dr
- 403 N Military St
- 117 Delores St
- 108 Delores St
- 110 Delores St
- 310 N Military St
- 310 N Military St
- 311 N Military St
- 112 Delores St
- 114 Delores St
- 116 Delores St
- 117 Park St
- 505 N Military St
- 119 Park St