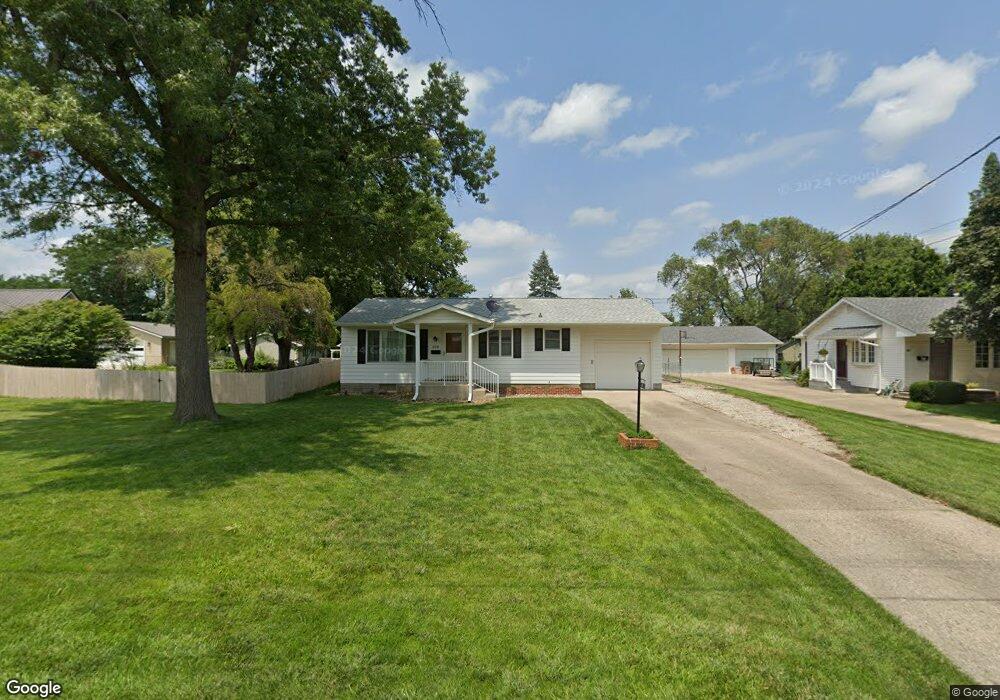
409 3rd St SE Altoona, IA 50009
Estimated Value: $201,000 - $239,000
2
Beds
1
Bath
884
Sq Ft
$248/Sq Ft
Est. Value
About This Home
This home is located at 409 3rd St SE, Altoona, IA 50009 and is currently estimated at $218,975, approximately $247 per square foot. 409 3rd St SE is a home located in Polk County with nearby schools including Centennial Elementary School, Southeast Polk Spring Creek- 6th Grade, and Southeast Polk Junior High School.
Ownership History
Date
Name
Owned For
Owner Type
Purchase Details
Closed on
Dec 31, 2003
Sold by
Advantage Homes Llc
Bought by
Marquis Builders Llc
Current Estimated Value
Home Financials for this Owner
Home Financials are based on the most recent Mortgage that was taken out on this home.
Original Mortgage
$143,000
Outstanding Balance
$67,061
Interest Rate
5.94%
Mortgage Type
Construction
Estimated Equity
$151,914
Create a Home Valuation Report for This Property
The Home Valuation Report is an in-depth analysis detailing your home's value as well as a comparison with similar homes in the area
Home Values in the Area
Average Home Value in this Area
Purchase History
| Date | Buyer | Sale Price | Title Company |
|---|---|---|---|
| Marquis Builders Llc | $34,500 | -- |
Source: Public Records
Mortgage History
| Date | Status | Borrower | Loan Amount |
|---|---|---|---|
| Open | Marquis Builders Llc | $143,000 |
Source: Public Records
Tax History Compared to Growth
Tax History
| Year | Tax Paid | Tax Assessment Tax Assessment Total Assessment is a certain percentage of the fair market value that is determined by local assessors to be the total taxable value of land and additions on the property. | Land | Improvement |
|---|---|---|---|---|
| 2024 | $3,240 | $205,600 | $44,900 | $160,700 |
| 2023 | $3,154 | $205,600 | $44,900 | $160,700 |
| 2022 | $3,110 | $166,800 | $38,000 | $128,800 |
| 2021 | $2,958 | $166,800 | $38,000 | $128,800 |
| 2020 | $2,906 | $151,500 | $34,300 | $117,200 |
| 2019 | $2,616 | $151,500 | $34,300 | $117,200 |
| 2018 | $2,686 | $135,100 | $30,100 | $105,000 |
| 2017 | $2,776 | $135,100 | $30,100 | $105,000 |
| 2016 | $2,766 | $126,900 | $27,700 | $99,200 |
| 2015 | $2,766 | $126,900 | $27,700 | $99,200 |
| 2014 | $2,532 | $116,000 | $25,400 | $90,600 |
Source: Public Records
Map
Nearby Homes
- 400 4th St SE
- 505 5th St SE
- 301 5th Street Place SE
- 136 8th NE
- 128 8th NE
- 120 8th NE
- 101 8th Ave SE
- 109 8th NE
- 109 8th Ave SE
- 136 8th Ave SE
- 128 8th Ave SE
- 120 8th Ave SE
- Lincoln Plan at Edgewood Trail
- Fairfield Plan at Edgewood Trail
- Madison Plan at Edgewood Trail
- Holland Plan at Edgewood Trail
- Reagan Plan at Edgewood Trail
- Neuville Plan at Edgewood Trail
- 603 1st Ave S
- 605 1st Ave S