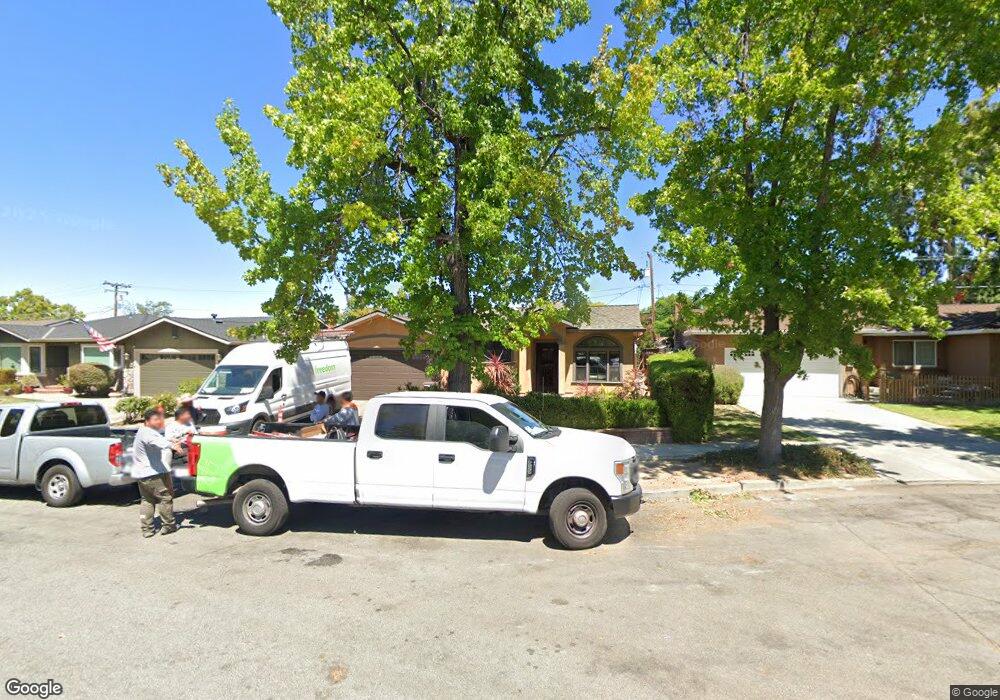
4090 Duggan Dr San Jose, CA 95118
Valley View-Reed NeighborhoodEstimated Value: $1,592,000 - $1,696,000
4
Beds
2
Baths
1,407
Sq Ft
$1,172/Sq Ft
Est. Value
About This Home
This home is located at 4090 Duggan Dr, San Jose, CA 95118 and is currently estimated at $1,648,944, approximately $1,171 per square foot. 4090 Duggan Dr is a home located in Santa Clara County with nearby schools including Reed Elementary School, John Muir Middle School, and Pioneer High School.
Ownership History
Date
Name
Owned For
Owner Type
Purchase Details
Closed on
Dec 11, 2002
Sold by
Byers Drew B and Austin Michele M
Bought by
Berg Stig and Enfield Karen B
Current Estimated Value
Home Financials for this Owner
Home Financials are based on the most recent Mortgage that was taken out on this home.
Original Mortgage
$360,000
Outstanding Balance
$152,633
Interest Rate
6.06%
Estimated Equity
$1,496,311
Purchase Details
Closed on
Feb 26, 1998
Sold by
Byers Drew D and Austin Michele M
Bought by
Byers Drew D and Austin Michele M
Home Financials for this Owner
Home Financials are based on the most recent Mortgage that was taken out on this home.
Original Mortgage
$219,000
Interest Rate
6.99%
Purchase Details
Closed on
Apr 4, 1996
Sold by
Nelson Kurt Lorin and Nelson Sharon Dean
Bought by
Byers Drew D and Austin Michele M
Home Financials for this Owner
Home Financials are based on the most recent Mortgage that was taken out on this home.
Original Mortgage
$206,600
Interest Rate
7.84%
Create a Home Valuation Report for This Property
The Home Valuation Report is an in-depth analysis detailing your home's value as well as a comparison with similar homes in the area
Home Values in the Area
Average Home Value in this Area
Purchase History
| Date | Buyer | Sale Price | Title Company |
|---|---|---|---|
| Berg Stig | $450,000 | Old Republic Title Company | |
| Byers Drew D | -- | Fidelity National Title Co | |
| Byers Drew D | $217,500 | All Cal Title Company |
Source: Public Records
Mortgage History
| Date | Status | Borrower | Loan Amount |
|---|---|---|---|
| Open | Berg Stig | $360,000 | |
| Previous Owner | Byers Drew D | $219,000 | |
| Previous Owner | Byers Drew D | $206,600 | |
| Closed | Berg Stig | $22,500 |
Source: Public Records
Tax History Compared to Growth
Tax History
| Year | Tax Paid | Tax Assessment Tax Assessment Total Assessment is a certain percentage of the fair market value that is determined by local assessors to be the total taxable value of land and additions on the property. | Land | Improvement |
|---|---|---|---|---|
| 2025 | $9,087 | $666,152 | $391,039 | $275,113 |
| 2024 | $9,087 | $653,091 | $383,372 | $269,719 |
| 2023 | $9,087 | $640,286 | $375,855 | $264,431 |
| 2022 | $8,807 | $627,733 | $368,486 | $259,247 |
| 2021 | $8,601 | $615,425 | $361,261 | $254,164 |
| 2020 | $8,390 | $609,115 | $357,557 | $251,558 |
| 2019 | $8,199 | $597,173 | $350,547 | $246,626 |
| 2018 | $8,106 | $585,465 | $343,674 | $241,791 |
| 2017 | $8,035 | $573,986 | $336,936 | $237,050 |
| 2016 | $7,864 | $562,732 | $330,330 | $232,402 |
| 2015 | $7,807 | $554,281 | $325,369 | $228,912 |
| 2014 | $7,158 | $531,659 | $318,996 | $212,663 |
Source: Public Records
Map
Nearby Homes
- 1619 Hallbrook Dr
- 1649 Glenville Dr
- 4460 Lahaina Way
- 1528 Willowdale Dr
- 1615 Corte de Callas
- 4285 Kirk Rd
- 3277 Ensalmo Ave
- 1398 Boysea Dr
- 3378 Thompson Ave
- 1655 Tupolo Dr
- 3310 Kirk Rd
- 1372 Branham Ln Unit 1
- 1448 Luning Dr
- 1359 Shawn Dr Unit 4
- 4450 Silva Ave
- 1514 San Joaquin Ave
- 1684 Tupolo Dr
- 3155 Franela Dr
- 1638 Branham Ln Unit D
- 3942 Paladin Dr
- 4082 Duggan Dr
- 4098 Duggan Dr
- 4095 Hastings Ave
- 4105 Hastings Ave
- 4077 Hastings Ave
- 4070 Duggan Dr
- 1564 Silvercrest Dr
- 4059 Hastings Ave
- 4133 Hastings Ave
- 4091 Duggan Dr
- 1568 Silvercrest Dr
- 4050 Duggan Dr
- 4075 Duggan Dr
- 4041 Hastings Ave
- 4165 Hastings Ave
- 1570 Silvercrest Dr
- 4055 Duggan Dr
- 1561 Hallbrook Dr
- 1563 Hallbrook Dr
- 4030 Duggan Dr