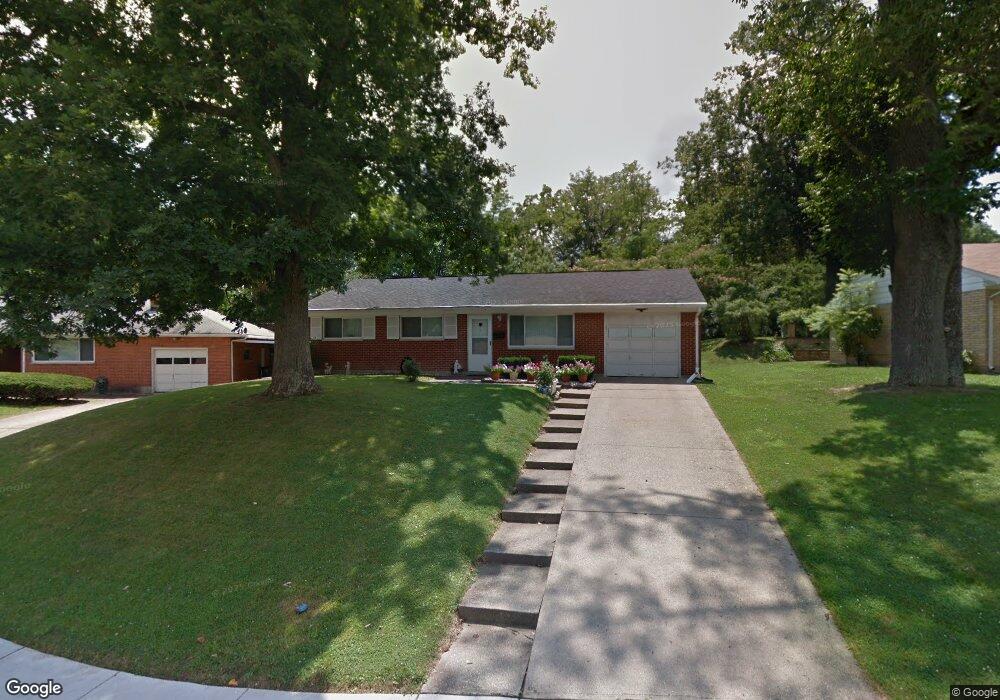
41 Chamberlin Ct Hamilton, OH 45013
Estimated Value: $187,029 - $203,000
3
Beds
1
Bath
1,064
Sq Ft
$184/Sq Ft
Est. Value
About This Home
This home is located at 41 Chamberlin Ct, Hamilton, OH 45013 and is currently estimated at $195,257, approximately $183 per square foot. 41 Chamberlin Ct is a home located in Butler County with nearby schools including Brookwood Elementary School, Wilson Middle School, and Hamilton High School Main Campus.
Ownership History
Date
Name
Owned For
Owner Type
Purchase Details
Closed on
Jan 7, 2024
Sold by
Luehrmann Albert J and Luehrmann Linda G
Bought by
Luehrmann Daniel J
Current Estimated Value
Home Financials for this Owner
Home Financials are based on the most recent Mortgage that was taken out on this home.
Original Mortgage
$116,000
Interest Rate
6.66%
Mortgage Type
New Conventional
Purchase Details
Closed on
Nov 7, 2005
Sold by
Luehrman Albert and Morphew Clarence
Bought by
Luehrmann Albert J and Luehrmann Linda G
Purchase Details
Closed on
Jan 25, 2003
Sold by
Burch Idola C
Bought by
Morphew Clarence and Morphew Juanita
Home Financials for this Owner
Home Financials are based on the most recent Mortgage that was taken out on this home.
Original Mortgage
$89,269
Interest Rate
6.01%
Mortgage Type
FHA
Purchase Details
Closed on
Mar 25, 1994
Create a Home Valuation Report for This Property
The Home Valuation Report is an in-depth analysis detailing your home's value as well as a comparison with similar homes in the area
Home Values in the Area
Average Home Value in this Area
Purchase History
| Date | Buyer | Sale Price | Title Company |
|---|---|---|---|
| Luehrmann Daniel J | $145,000 | None Listed On Document | |
| Luehrmann Daniel J | $145,000 | None Listed On Document | |
| Luehrmann Albert J | -- | None Listed On Document | |
| Luehrmann Albert J | -- | None Listed On Document | |
| Luehrmann Albert J | -- | -- | |
| Morphew Clarence | $90,000 | -- | |
| -- | $38,200 | -- |
Source: Public Records
Mortgage History
| Date | Status | Borrower | Loan Amount |
|---|---|---|---|
| Previous Owner | Luehrmann Daniel J | $116,000 | |
| Previous Owner | Morphew Clarence | $89,269 |
Source: Public Records
Tax History
| Year | Tax Paid | Tax Assessment Tax Assessment Total Assessment is a certain percentage of the fair market value that is determined by local assessors to be the total taxable value of land and additions on the property. | Land | Improvement |
|---|---|---|---|---|
| 2025 | $2,204 | $50,880 | $10,820 | $40,060 |
| 2024 | $2,204 | $50,880 | $10,820 | $40,060 |
| 2023 | $2,194 | $51,840 | $10,820 | $41,020 |
| 2022 | $1,890 | $37,250 | $10,820 | $26,430 |
| 2021 | $1,680 | $36,140 | $10,820 | $25,320 |
| 2020 | $1,750 | $36,140 | $10,820 | $25,320 |
| 2019 | $2,168 | $29,610 | $9,950 | $19,660 |
| 2018 | $1,416 | $29,610 | $9,950 | $19,660 |
| 2017 | $1,428 | $29,610 | $9,950 | $19,660 |
| 2016 | $1,810 | $27,290 | $9,950 | $17,340 |
| 2015 | $1,373 | $27,290 | $9,950 | $17,340 |
| 2014 | $1,889 | $27,290 | $9,950 | $17,340 |
| 2013 | $1,889 | $30,070 | $9,950 | $20,120 |
Source: Public Records
Map
Nearby Homes
- 104 Chamberlin Dr
- 61 Essex Ct
- 751 Springvale Dr
- 540 Carlisle Ave
- 1475 Diana Dr
- 205 Olympus Dr
- 75 Berkshire Ct
- 30 Berkshire Ct
- 1020 Westview Ave
- 1102 Arbor Springs Dr
- 42 Ramsey Dr
- 974 Westview Ave
- 824 Carlisle Ave
- 925 Carlisle Ave
- 4 Kensington Dr
- 987 Carlisle Ave
- 936 Elizabeth Dr
- 30 S Washington Blvd
- 1326 Franklin St
- 732 Millville Ave
- 31 Chamberlin Ct
- 51 Chamberlin Ct
- 21 Chamberlin Ct
- 61 Chamberlin Ct
- 60 Chamberlin Ct
- 40 Chamberlin Ct
- 176 Chamberlin Dr
- 50 Chamberlin Ct
- 190 Chamberlin Dr
- 20 Chamberlin Ct
- 160 Chamberlin Dr
- 208 Chamberlin Dr
- 146 Chamberlin Dr
- 195 Chamberlin Dr
- 207 Chamberlin Dr
- 183 Chamberlin Dr
- 216 Chamberlin Dr
- 171 Chamberlin Dr
- 46 W Persimmon Dr
- 132 Chamberlin Dr
Your Personal Tour Guide
Ask me questions while you tour the home.