Estimated Value: $553,000 - $687,000
4
Beds
4
Baths
2,248
Sq Ft
$266/Sq Ft
Est. Value
About This Home
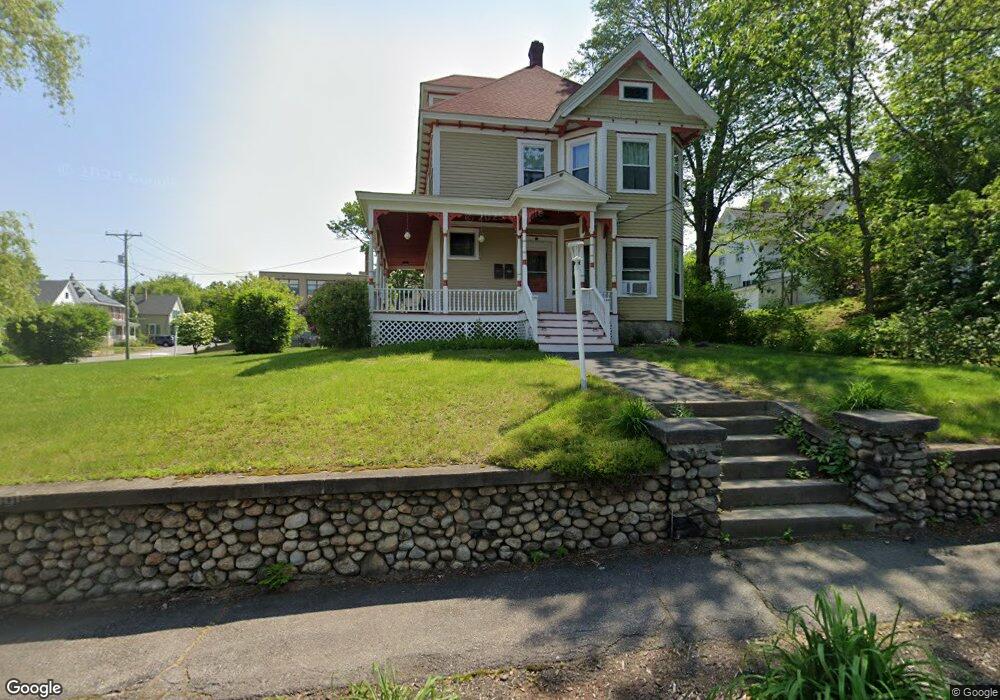
This home is located at 41 Franklin St, Derry, NH 03038 and is currently estimated at $597,608, approximately $265 per square foot. 41 Franklin St is a home located in Rockingham County with nearby schools including Grinnell School, Gilbert H. Hood Middle School, and Pinkerton Academy.
Ownership History
Date
Name
Owned For
Owner Type
Purchase Details
Closed on
Jul 22, 2002
Sold by
Mary Hilsse Thomas and Mary Hilsse
Bought by
Dors Lisa Ann
Current Estimated Value
Home Financials for this Owner
Home Financials are based on the most recent Mortgage that was taken out on this home.
Original Mortgage
$193,600
Outstanding Balance
$82,187
Interest Rate
6.73%
Estimated Equity
$515,421
Purchase Details
Closed on
Oct 23, 1996
Sold by
Crowley Steven F and Crowley Lisa M R
Bought by
Hilse Thomas and Hilse Mary
Home Financials for this Owner
Home Financials are based on the most recent Mortgage that was taken out on this home.
Original Mortgage
$137,628
Interest Rate
8.22%
Create a Home Valuation Report for This Property
The Home Valuation Report is an in-depth analysis detailing your home's value as well as a comparison with similar homes in the area
Home Values in the Area
Average Home Value in this Area
Purchase History
| Date | Buyer | Sale Price | Title Company |
|---|---|---|---|
| Dors Lisa Ann | $242,000 | -- | |
| Hilse Thomas | $139,000 | -- |
Source: Public Records
Mortgage History
| Date | Status | Borrower | Loan Amount |
|---|---|---|---|
| Open | Hilse Thomas | $193,600 | |
| Previous Owner | Hilse Thomas | $137,628 |
Source: Public Records
Tax History Compared to Growth
Tax History
| Year | Tax Paid | Tax Assessment Tax Assessment Total Assessment is a certain percentage of the fair market value that is determined by local assessors to be the total taxable value of land and additions on the property. | Land | Improvement |
|---|---|---|---|---|
| 2024 | $9,078 | $485,700 | $212,300 | $273,400 |
| 2023 | $7,970 | $385,400 | $180,400 | $205,000 |
| 2022 | $7,338 | $385,400 | $180,400 | $205,000 |
| 2021 | $7,304 | $295,000 | $136,600 | $158,400 |
| 2020 | $7,180 | $295,000 | $136,600 | $158,400 |
| 2019 | $7,076 | $270,900 | $103,300 | $167,600 |
| 2018 | $6,413 | $270,900 | $103,300 | $167,600 |
| 2017 | $6,089 | $215,500 | $89,200 | $126,300 |
| 2016 | $5,831 | $215,500 | $89,200 | $126,300 |
| 2015 | $5,317 | $181,900 | $75,100 | $106,800 |
| 2014 | $5,351 | $181,900 | $75,100 | $106,800 |
| 2013 | $5,426 | $172,300 | $70,400 | $101,900 |
Source: Public Records
Map
Nearby Homes
- 8 Laurel St
- 32 Crystal Ave
- 60 N High St
- 3 Exeter St
- 18 Maple St Unit 1
- 84 E Broadway
- 8 Birch St
- 18 Elm St
- 23 Oak St
- 24 Jefferson St
- 12 Perley Rd Unit 21
- 29 Central St
- 31 South Ave Unit B
- 31 South Ave Unit L
- 24 South Ave
- 37 Highland Ave Unit 1
- 5 Tsienneto Rd Unit 10
- 5 Tsienneto Rd Unit 127
- 5 Tsienneto Rd Unit 170
- 5 Tsienneto Rd Unit 41