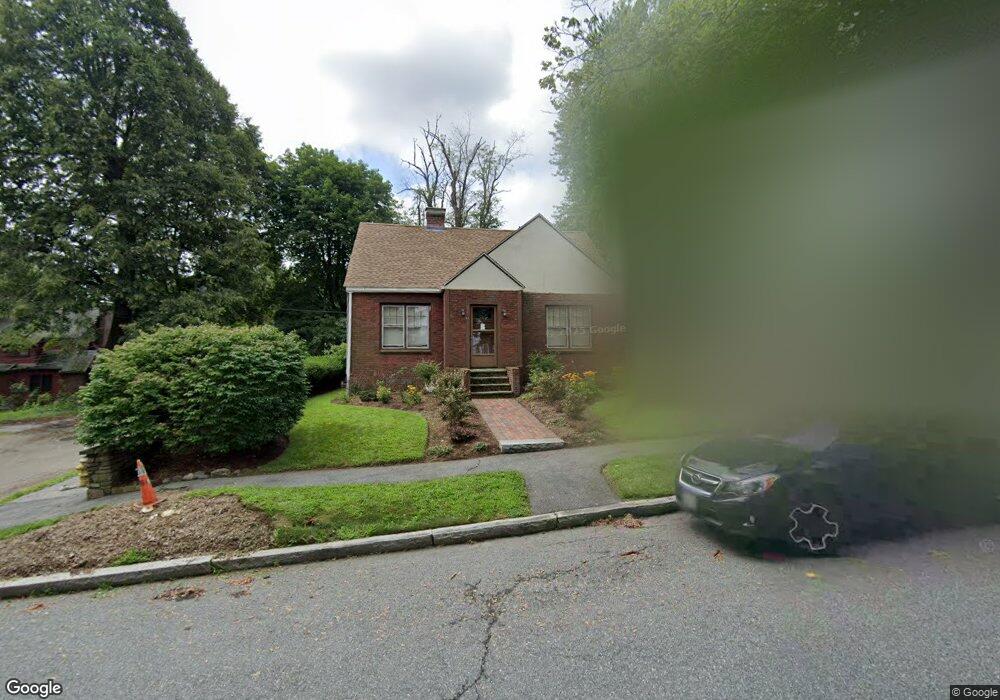
41 Gifford Dr Worcester, MA 01606
Indian Lake East NeighborhoodEstimated Value: $331,000 - $406,000
2
Beds
3
Baths
1,122
Sq Ft
$326/Sq Ft
Est. Value
About This Home
This home is located at 41 Gifford Dr, Worcester, MA 01606 and is currently estimated at $365,467, approximately $325 per square foot. 41 Gifford Dr is a home located in Worcester County with nearby schools including Francis J. McGrath Elementary School, Jacob Hiatt Magnet School, and Chandler Magnet.
Ownership History
Date
Name
Owned For
Owner Type
Purchase Details
Closed on
Jun 28, 2023
Sold by
Gardner Ellen J
Bought by
Ellen J Gardner 2023 Irt and Capone
Current Estimated Value
Purchase Details
Closed on
Nov 28, 1994
Sold by
Girardi Alice A
Bought by
Gardner Ellen J
Home Financials for this Owner
Home Financials are based on the most recent Mortgage that was taken out on this home.
Original Mortgage
$7,123
Interest Rate
9.16%
Create a Home Valuation Report for This Property
The Home Valuation Report is an in-depth analysis detailing your home's value as well as a comparison with similar homes in the area
Home Values in the Area
Average Home Value in this Area
Purchase History
| Date | Buyer | Sale Price | Title Company |
|---|---|---|---|
| Ellen J Gardner 2023 Irt | -- | None Available | |
| Gardner Ellen J | $86,000 | -- |
Source: Public Records
Mortgage History
| Date | Status | Borrower | Loan Amount |
|---|---|---|---|
| Previous Owner | Gardner Ellen J | $7,123 | |
| Previous Owner | Gardner Ellen J | $64,500 | |
| Closed | Gardner Ellen J | $17,200 |
Source: Public Records
Tax History
| Year | Tax Paid | Tax Assessment Tax Assessment Total Assessment is a certain percentage of the fair market value that is determined by local assessors to be the total taxable value of land and additions on the property. | Land | Improvement |
|---|---|---|---|---|
| 2025 | $4,200 | $318,400 | $97,900 | $220,500 |
| 2024 | $4,121 | $299,700 | $97,900 | $201,800 |
| 2023 | $3,958 | $276,000 | $85,100 | $190,900 |
| 2022 | $3,638 | $239,200 | $68,100 | $171,100 |
| 2021 | $3,435 | $211,000 | $54,500 | $156,500 |
| 2020 | $3,356 | $197,400 | $54,500 | $142,900 |
| 2019 | $3,197 | $177,600 | $49,000 | $128,600 |
| 2018 | $3,211 | $169,800 | $49,000 | $120,800 |
| 2017 | $3,064 | $159,400 | $49,000 | $110,400 |
| 2016 | $3,026 | $146,800 | $36,400 | $110,400 |
| 2015 | $2,946 | $146,800 | $36,400 | $110,400 |
| 2014 | $2,868 | $146,800 | $36,400 | $110,400 |
Source: Public Records
Map
Nearby Homes
- 6 Roald St
- 31 Boardman St
- 44 Boardman St
- 36 Eagle Rd
- 577 Grove St
- 14 Balder Rd
- 32 Hemans St
- 10 Dryden St Unit 7
- 6 Ashburnham Rd
- 20B Edgeworth St
- 63 North St Unit D
- 63 North St Unit C
- 63 North St Unit B
- 63 North St Unit A
- 40 Westwood Dr
- 15 Ericsson St
- 8 Old Colony Rd
- 18 Gosnold St
- 25 Chester St
- 100 Burncoat St
Your Personal Tour Guide
Ask me questions while you tour the home.